About Me

I'm a data product and analytics leader with 15+ years building systems that turn complex data into decisions people can actually act on. My work sits at the intersection of enterprise BI, healthcare data strategy, and human-centered design - and I've come to believe that good data design is an act of care for the people using it.
That belief isn't just professional - it's personal. A life shaped by health challenges and a long-COVID recovery taught me firsthand how much the right information, at the right moment, can change what's possible. That hard-earned knowledge drives everything I build.
My career has spanned two worlds that rarely talk to each other: behavioral health program design and enterprise analytics platforms. At Ionia, Inc. in rural Alaska, I redesigned workflows for programs serving individuals with cognitive disabilities, virtualized health programs in 27 days during COVID, and built the reporting infrastructure that kept grant-funded programs funded. At Onyx CenterSource, I advanced a BI product from alpha to commercial launch - generating $600K+ in pipeline where a prior multi-million-dollar consulting effort had produced nothing - and later led the analytics function as Manager of Business Data Analytics.
I'm completing an M.S. in Data Science and Analytics at the University of Missouri, focused on Human-Centered Design and Healthcare Data, and I'm looking for roles where analytics rigor and product thinking combine to genuinely improve how people experience health systems and data.
Core Strengths
Data Product Strategy: end-to-end product lifecycle ownership from discovery through commercial launch
Healthcare Analytics: population health metrics, HIPAA-compliant data systems, patient outcome measurement
Human-Centered Design: usability research, heuristic evaluation, accessibility-first design, friction minimization
Enterprise BI: SQL, Python, Tableau, AWS Redshift, ETL design, KPI frameworks, executive-level reporting
Behavioral Insight: translating behavioral signals into product decisions, engagement design, motivational architecture
Cross-Functional Leadership: engineering, design, and data partnerships; analyst coaching; stakeholder alignment
Columbia, MO | Remote
Projects
Click a project's title or image to learn more
OnyxInsights
 Where a prior multi-million-dollar consulting effort produced zero revenue, a lean three-person team launched a flagship enterprise BI platform to commercial success. I led end-to-end product development - from data architecture and dashboard UX through client enablement - generating $600K+ in pipeline in the platform's first year.
Population Health Explorer
Where a prior multi-million-dollar consulting effort produced zero revenue, a lean three-person team launched a flagship enterprise BI platform to commercial success. I led end-to-end product development - from data architecture and dashboard UX through client enablement - generating $600K+ in pipeline in the platform's first year.
Population Health Explorer
 An underutilized population health dashboard was losing users to cognitive overload, accessibility barriers, and an unfocused scope. Heuristic evaluation and usability research drove a targeted redesign that produced measurable gains in engagement, sustained usage, and task completion efficiency.
Rural Transit Ride Tracking System
An underutilized population health dashboard was losing users to cognitive overload, accessibility barriers, and an unfocused scope. Heuristic evaluation and usability research drove a targeted redesign that produced measurable gains in engagement, sustained usage, and task completion efficiency.
Rural Transit Ride Tracking System
 A transit cost-share program serving individuals with cognitive disabilities was losing reimbursements and burning out drivers due to complex, error-prone manual logging. Through participatory design and an accessibility-first rebuild, I eliminated outsourced reconciliation and increased cost-share reimbursements by approximately 300%.
Health Seminar Virtualization
A transit cost-share program serving individuals with cognitive disabilities was losing reimbursements and burning out drivers due to complex, error-prone manual logging. Through participatory design and an accessibility-first rebuild, I eliminated outsourced reconciliation and increased cost-share reimbursements by approximately 300%.
Health Seminar Virtualization
 COVID-19 threatened $250K in grant funding tied to in-person health program delivery requirements - with no precedent and 27 days to respond. I designed and launched a fully virtual wellness program from scratch, accommodating participants with disabilities and technophobia while preserving every dollar of revenue and expanding the program's reach.
BRFSS Dashboards
COVID-19 threatened $250K in grant funding tied to in-person health program delivery requirements - with no precedent and 27 days to respond. I designed and launched a fully virtual wellness program from scratch, accommodating participants with disabilities and technophobia while preserving every dollar of revenue and expanding the program's reach.
BRFSS Dashboards
 The nation's premier public health survey dataset is powerful but largely inaccessible to the clinicians, policy makers, and researchers who need it. I cleaned and analyzed 2.3 million BRFSS records and published open-access data subsets and interactive Tableau dashboards to put those insights into the hands of people who can act on them.
Sales Targeting Suite
The nation's premier public health survey dataset is powerful but largely inaccessible to the clinicians, policy makers, and researchers who need it. I cleaned and analyzed 2.3 million BRFSS records and published open-access data subsets and interactive Tableau dashboards to put those insights into the hands of people who can act on them.
Sales Targeting Suite
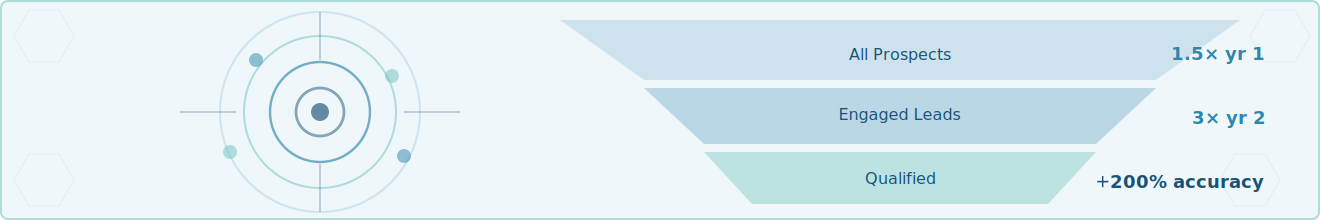 Fragmented, outdated data was slowing revenue teams and undermining lead quality across sales, presales, and actualization functions. Through iterative UX design and continuous user testing, I built a sales-enablement dashboard suite that drove 1.5x team engagement in year one and ~3x by year two.
Resume
Summary
Data product and analytics leader with 15+ years designing enterprise BI platforms, owning product strategy, and translating complex data into decisions people can act on. Deep experience in healthcare analytics, human-centered design, and AI-enabled tooling. Proven track record launching data products from concept to commercial impact, building cross-functional analytics teams, and embedding insight into real workflows.
Technical Skills
BI Product Ownership          Human-Centered Design
Healthcare Analytics          Usability Research & Testing
SQL / Python / Tableau        Heuristic Evaluation
AWS Redshift / ETL Design     Behavioral Insight Design
Statistical Modeling          Population Health Metrics
Data Governance               HIPAA / PHI Data Systems
Stakeholder Communication     Cross-Functional Leadership
AI-Enabled Decision Systems   Roadmap & Prioritization
Experience
Manager, Business Data Analytics
Onyx CenterSource | Remote | July 2025 – Present
- Owned the full BI product lifecycle - discovery, roadmap, iterative delivery, and client strategy - doubling annual contract value through new customer growth
- Designed AI-enabled decision-support workflows that reduced cognitive load across product surfaces while preserving interpretability and user trust
- Built a sales-enablement dashboard suite that drove 1.5x engagement in year one and ~3x in year two through iterative UX and user testing cycles
- Established data governance standards and KPI frameworks across a globally distributed team; delivered board-level and investor-facing analytics presentations
Business Data Analyst
Onyx CenterSource | Remote | May 2023 – July 2025
- Advanced a prototype BI product from alpha to commercial launch - database design, pipeline development, dashboard UX, and usability evaluation - generating $600K+ in product pipeline
- Increased prospect targeting accuracy by 200% with a market penetration dashboard that reshaped go-to-market strategy
- Accelerated dashboard load times 11.2x by restructuring AWS Redshift data tables and rewriting SQL and Tableau logic
Independent Analytics Consultant
Self-employed | Columbia, MO | April 2021 – May 2023
- Delivered quantitative cost models and ROI forecasting that reduced client operational waste by 30%
- Achieved 25% higher project margins than peers through executive-ready analytics insights and workflow optimization
Senior Project Manager & Data Consultant
Ionia, Inc. | Kasilof, AK | January 2018 – April 2021
- Preserved 19% of annual revenue during COVID-19 by redesigning in-person health programs into a virtual delivery platform - from concept to launch in 27 days
- Designed at-home health and wellness intervention programs achieving 82%+ participant satisfaction
- Managed $200K+ in grant-funded programs with full federal regulatory reporting compliance
Data Analyst & Project Coordinator
Ionia, Inc. | Kasilof, AK | June 2012 – December 2018
- Built data cleaning and validation routines that decreased errors by 38% and secured 6% of annual revenue
- Improved organizational performance visibility by 32% through monthly narrative-driven analytics reports tied to program KPIs
- Redesigned a ride-tracking product for transit drivers with cognitive disabilities, increasing cost-share reimbursements ~300%
Academic
M.S. Data Science & Analytics (In Progress)
Focus:Human-Centered Design & Healthcare Data
University of Missouri, Columbia | Expected 2026
Data Analytics Certification
Career Foundry | 2022
B.A. Visual Arts, Summa Cum Laude
University of California, Los Angeles | 2009
Contact
For questions, opportunities, or collaboration, feel free to reach out via LinkedIn or email.
You may also explore my work on Tableau, GitHub, and Kaggle.
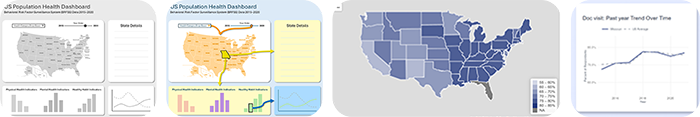
BRFSS Dashboards
Summary
The Behavioral Risk Factor Surveillance System (BRFSS) is the nation's premier source for state-level population health data - but its raw format is dense, technical, and largely inaccessible to the people who need it most. I cleaned, wrangled, and analyzed 2.3 million records across 54 states and territories (2011-2021), then published open-access data subsets and interactive Tableau dashboards to make those insights usable. The project spans the full analytics lifecycle: from data governance and EDA through geospatial analysis, regression modeling, and public-facing visualization.
Tools & Skills
Python • Jupyter • Tableau • Excel • GitHub • Kaggle • Data Cleaning • Geospatial Analysis • Correlation Analysis • Linear Regression • Time-Series Analysis • Open-Source Publishing
Key Outcomes
Transformed 2.3M raw survey records into publicly accessible health dashboards and open datasets used by healthcare professionals, policy makers, and researchers.
- Published five open-access BRFSS data subsets on Kaggle covering overall, general, mental, dietary, and physical health
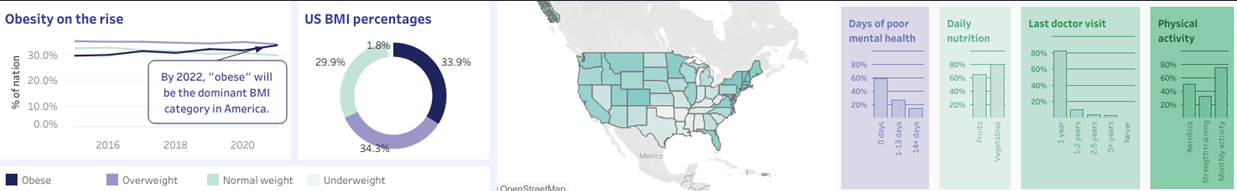
- Built interactive Tableau dashboards revealing that 66% of Americans are overweight or obese and the South ranks lowest across five major health categories
- Developed a formal state ranking system weighting six health categories - enabling comparative analysis not available in the original BRFSS format
GitHub Repository
BRFSS by State Dashboard
Obesity in America Dashboard
Population Health Explorer
Summary
An underutilized population health dashboard was struggling with low adoption due to cognitive overload, poor visual hierarchy, and accessibility gaps. I conducted heuristic evaluations and distributed user surveys to surface the root causes, then prioritized and implemented UX improvements aligned to real user needs. The redesigned dashboard was simpler, more accessible, and measurably more effective - demonstrating that targeted human-centered design changes can produce outsized gains in engagement and efficiency.
Tools & Skills
Tableau • R Shiny • Figma • UX Research • Heuristic Evaluation • Accessibility Design • Iterative Prototyping • Usability Testing
Key Outcomes
Delivered measurable improvements in engagement, sustained usage, and task completion efficiency following redesign.
- Reduced visual complexity and cognitive load through simplified scope, refined hierarchy, and improved color contrast
- Improved accessibility for users with visual impairments by addressing contrast and layout issues identified in evaluation
- Increased time-on-task efficiency and sustained usage by aligning dashboard content to primary user workflows
UX Standards
View Dashboard
Research Findings
Sales Targeting Suite
Out of respect for confidentiality and data governance requirements, this case study presents a high-level overview. Certain details have been anonymized or generalized.
Summary
Sales, presales, and actualization teams were working from fragmented, outdated data that slowed workflows and undermined lead quality. I designed and iteratively evolved a sales-enablement dashboard suite that centralized performance data into a single, actionable interface - built through continuous UX cycles, usability testing, and direct stakeholder collaboration. The product embedded itself into daily workflows and became a measurable driver of team performance and qualified lead growth.
Tools & Skills
SQL • Python • Tableau • UX Research • Usability Testing • KPI Framework Design • Iterative Prototyping • Stakeholder Alignment
Key Outcomes
Drove a sustained rise in qualified leads and team engagement through design iteration grounded in real user behavior and workflow constraints.
- Increased sales, presales, and actualization team engagement 1.5x in year one and ~3x in year two
- Improved prospect targeting accuracy by 200% with market penetration analysis that reshaped go-to-market strategy
- Reduced cognitive load through standardized KPI definitions and simplified visual hierarchy across all dashboards
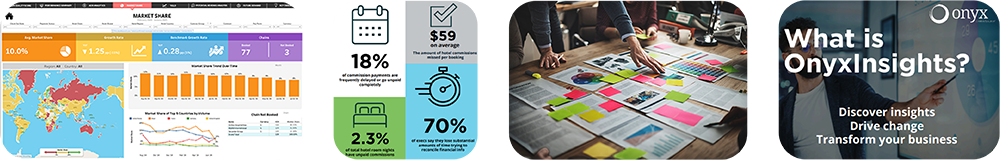
OnyxInsights
Out of respect for confidentiality and data governance requirements, this case study presents a high-level overview. Certain details have been anonymized or generalized.
Summary
OnyxInsights is the flagship BI platform for Onyx CenterSource, built to transform complex hospitality payment, booking, and commission data into benchmark-driven intelligence. I entered the project mid-wireframe and led end-to-end development of production dashboards, data models, and client-facing analytics - taking a product to market where a prior multi-million-dollar consulting effort had generated zero revenue. Through iterative UX testing and close collaboration with sales, engineering, and product teams, the platform became a commercially viable, scalable analytics solution serving global enterprise clients.
Tools & Skills
SQL • Python • Tableau • AWS Redshift • UX Research • Iterative Prototyping • Stakeholder Communication • Go-to-Market Enablement
Key Outcomes
Generated $600K+ in product pipeline in the platform's first year of commercial availability - the first revenue the product had ever produced.
- Increased individual client annual contract value by ~20% through high-impact BI dashboards and strategic analytics sessions
- Improved dashboard load performance 11.2x by restructuring data architecture and optimizing SQL and Tableau logic
- Contributed to published thought leadership content and sales enablement materials that supported market positioning
View Platform
Thought Leadership
Health Seminar Virtualization
Out of respect for confidentiality and data governance requirements, this case study presents a high-level overview. Certain details have been anonymized or generalized.
Summary
When COVID-19 abruptly shut down in-person wellness programs, a health and wellness non-profit faced a critical threat to $250K in grant funding tied to program delivery requirements. I designed and launched a fully virtual wellness program in 27 days - converting multi-day in-person health seminars into accessible streaming experiences, procuring AV equipment, onboarding instructors, and training staff. The program was designed with accessibility at its center, accommodating participants with learning disabilities, mental health challenges, and technophobia throughout.
Tools & Skills
Zoom • LMS Platform • Asana • Rapid Product Design • Accessibility-First UX • Staff Training • Stakeholder Communication • Crisis-Driven Project Management
Key Outcomes
Preserved critical revenue and grant compliance while expanding program reach - and established a virtual delivery model the organization still runs today.
- Preserved 19% of annual revenue ($250K in grant funding) by meeting program delivery requirements under COVID-19 constraints
- Launched a fully operational virtual program in 27 days, from concept to live delivery
- Expanded program reach beyond in-person geographic limits while reducing per-session overhead costs
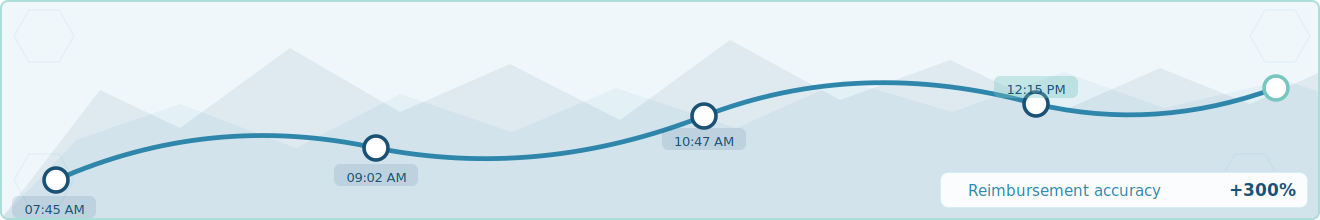
Rural Transit Ride Tracking System
Out of respect for confidentiality and data governance requirements, this case study presents a high-level overview. Certain details have been anonymized or generalized.
Summary
A rural Alaska transit cost-share program serving individuals with mental illnesses and cognitive disabilities relied on complex paper-based logging that produced incomplete records, lost reimbursements, and high driver burnout. Through participatory design with drivers and close collaboration with engineering partners, I led the redesign of the tracking system from the ground up - simplifying in-vehicle forms to reduce cognitive demand and building a locally hosted, auto-correcting data entry system matched to real-world constraints. This is the project that taught me that good data design can become a genuine act of care.
Tools & Skills
Python • Excel • Participatory Design • Contextual Research • Accessibility-First UX • Low-Fidelity Prototyping • Systems Thinking • Cross-Functional Project Leadership
Key Outcomes
Dramatically improved data quality, reduced driver cognitive load, and stabilized both program funding and staffing through human-centered redesign.
- Increased cost-share reimbursements by approximately 300% through improved data accuracy and completeness
- Eliminated outsourced reconciliation by building an auto-correcting local data system that caught and resolved common errors at entry
- Reduced staff burnout and improved driver retention by simplifying workflows matched to real cognitive and environmental constraints