About Me

Data and product leader with two decades of experience building analytics solutions, shaping data-informed experiences, and helping organizations turn complex behavior signals into clear, motivating action.
I specialize in BI product ownership, behavioral insight design, and creating experience frameworks that help people build healthier habits. My work blends analytical rigor with human-centered thinking – using experimentation, narrative, and iteration to improve engagement, reduce friction, and scale impact across cross-functional teams.
I’ve led work at the intersection of research, design, and analytics, partnering with engineers, clinicians, analysts, and customer-facing teams to shape products from early discovery through launch and iteration. My background includes translating behavioral theory into practical digital workflows, designing self-guided and coach-supported experiences, and using experimentation to refine engagement over time.
I have adeep passion for synthesizing qualitative insight with quantitative modeling to surface opportunity, guide prioritization, and ensure solutions are usable, motivating, and grounded in real-world constraints.
Key Skills
Behavioral Insight & Experience Design: translating signals into motivations, nudges, and habit-forming flows
Product Strategy: roadmap design, requirements definition, iterative prototyping, feature validation
Analytics & Modeling: SQL, Python, segmentation, forecasting, payment lifecycle analytics, yield optimization
Data Storytelling: dashboards, experience summaries, opportunity framing, narrative-driven design
Cross-Functional Leadership: engineering + design + data partnerships, coaching analysts, stakeholder alignment
Usability & Research: qualitative/quantitative synthesis, scenario-based studies, friction-point analysis
Columbia, MO | Remote
Projects
[Click a project's title or image to learn more]
OnyxInsights
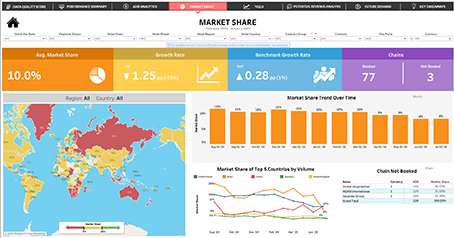
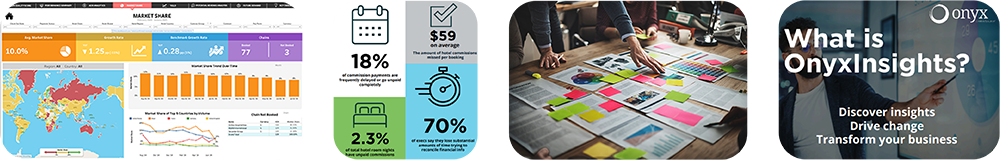 Hotels and travel management companies struggle with fragmented booking data, minimal market context, and negligible competitive intel which inhibit strategic business decisions. OnyxInsights centralizes, transforms, and supplements this complex data into clear, benchmark-driven business intelligence. Organizations gain visibility into performance, uncover growth opportunities, and make confident, data-driven decisions.
Sales Targeting Suite
Hotels and travel management companies struggle with fragmented booking data, minimal market context, and negligible competitive intel which inhibit strategic business decisions. OnyxInsights centralizes, transforms, and supplements this complex data into clear, benchmark-driven business intelligence. Organizations gain visibility into performance, uncover growth opportunities, and make confident, data-driven decisions.
Sales Targeting Suite
Sales, pre-sales, and actualization teams struggled with fragmented, outdated information that slowed daily workflows and undermined lead quality. A sales-enablement product was designed and iteratively improved through continuous UX iteration and user testing to centralize insights and streamline execution. As a result, adoption increased across teams, driving a sustained rise in qualified leads and more effective day-to-day performance.
Population Health Explorer
 An underutilized population health dashboard suffered from cognitive overload, accessibility issues, and unclear focus. Heuristic evaluations and usability testing to identify pain points, then prioritized and implemented UX and visual design improvements aligned to user needs. The evolved dashboard achieved higher engagement, longer continuous usage, and faster task completion.
Health Seminar Virtualization
An underutilized population health dashboard suffered from cognitive overload, accessibility issues, and unclear focus. Heuristic evaluations and usability testing to identify pain points, then prioritized and implemented UX and visual design improvements aligned to user needs. The evolved dashboard achieved higher engagement, longer continuous usage, and faster task completion.
Health Seminar Virtualization
COVID-19 halted in-person wellness programs, threatening critical grant requirements tied to $600K of annual revenue. I designed and launched a fully virtual wellness program in 27 days, converting multi-day, in-person seminars into accessible streaming and recorded sessions while training staff and accommodating participant needs. This preserved key revenue streams, fulfilled grant obligations, expanded program reach, reduced overhead costs, and established a scalable virtual delivery model.
Rural Transit Ride Tracking System
A rural transit cost-share program serving individuals with mental disabilities relied on complex manual logging that led to lost reimbursements, heavy administrative burden, and high driver turnover. Through close collaboration with drivers and technical stakeholders, the system was redesigned to be accessible and error-tolerant, eliminating outsourced reconciliation, reducing burnout, and increasing cost-share reimbursements by approximately 300%.
BRFSS Dashboards
 Transforming oblique health survey records into accessible public dashboards. I cleaned, wrangled, and analyzed the BRFSSs’ 2.3 million records to help increase awareness of health trends across the nation.
Resume
Summary
Senior data and product practitioner focused on creating insight-driven tools that guide people toward better decisions and sustained behavior change. My background spans analytics platforms and experience design, where I apply research, testing, and storytelling to simplify complexity and drive adoption across multidisciplinary teams.
Skills
BI Product Ownership               Systems Thinking
Behavioral Insight Design          Journey Mapping
Product Strategy & Roadmapping     Data Storytelling
Product Discovery & Validation     Stakeholder Alignment
Human-Centered & Inclusive Design  Research Synthesis
Experience Framework Design        Outcome Measurement
Heuristic Evaluation               Usability Testing
Data Modeling & Pipeline Design    Python
Segmentation & Forecasting         Tableau
Cross-Functional Leadership        SQL
Experience
Manager, Business Data Analytics
Onyx CenterSource | Remote | July 2025 – Present
- Directed the flagship BI product, revitalizing the product roadmap, strengthening client relationships, and doubling annual contract value through new customer growth
- Designed and launched a new analytics product capturing historically low-penetration customer segments; applied user research, heuristic testing, and iterative prototyping to support successful sales engagement
- Built a sales-enablement dashboard suite that increased sales, presales, and actualization engagement 1.5× in year one and ~3× in year two through iterative UX and user testing cycles
- Delivered advanced client-facing BI dashboards that increased individual client ACV by ~20% and expanded strategic account conversations.
Business Data Analyst
Onyx CenterSource | Remote | May 2023 – July 2025
- Advanced a prototype BI product from alpha to launch, including database design, pipeline development, dashboard UI/UX, usability evaluation, and a 9-dashboard self-service demo that generated $600K+ in product pipeline opportunities
- Created a market penetration dashboard that reshaped market strategy, dispelling long-standing misconceptions, and improving prospect targeting accuracy by 200%
- Optimized BI product performance by restructuring data tables and rewriting SQL/Tableau logic, accelerating dashboard load times by 11.2x
- Developed product lifecycle analytics to identify delays and propose process fixes, accelerating payment timelines and improving NPS/client retention.
Independent Contractor and Consultant
Self-employed | Columbia, MO | April 2021 – May 2023
- Designed product-specific cost and materials models that decreased waste and increased ROI by 30%
- Improved communication workflows between clients and contractors, achieving 25% higher profitability per project vs. peers
- Coordinated client-contractor-supplier operations to streamline distribution and accelerate project delivery by 20%
Senior Project Manager
Ionia, Inc. | Kasilof, AK | January 2018 – April 2021
- Launched virtual wellness products in 27 days, preserving 19% of annual revenue during COVID by redesigning user journeys for remote engagement
- Led cross-functional teams delivering health and behavioral programs with 82%+ participant satisfaction
- Managed a $200K+ portfolio of grant-funded programs focused on health and wellness outcomes
Data Analyst & Project Coordinator
Ionia, Inc. | Kasilof, AK | June 2012 – December 2018
- Redesigned a ride-tracking product and workflows using behavioral, touch-point , and engagement research, reducing staff burnout by 12% and operational waste by 36%
- Built operational data pipelines that decreased errors by 38% and protected 6% of revenue
- • Produced monthly decision-intelligence reports that increased organizational performance awareness by 32%
Academic
M.S. Data Science & Analytics (In Progress)
Emphasis in Human-Centered Design and Bioinformatics
University of Missouri, Columbia
2026 (In Progress)
Data Analytics Certification
Career Foundry
2022
B.A. Visual Arts, Summa Cum Laude
University of California, Los Angeles
2009
Contact
For questions, opportunities, or collaboration, feel free to reach out via LinkedIn or email.
You may also explore my work on Tableau, GitHub, and Kaggle.
BRFSS Dashboards
Summary
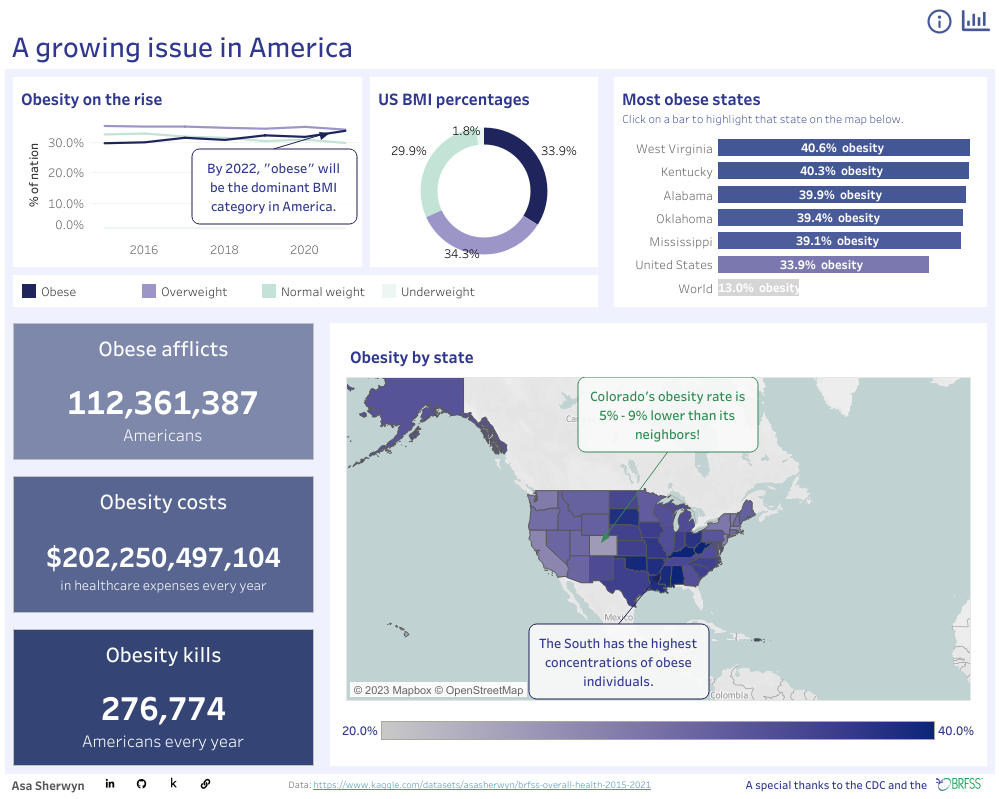
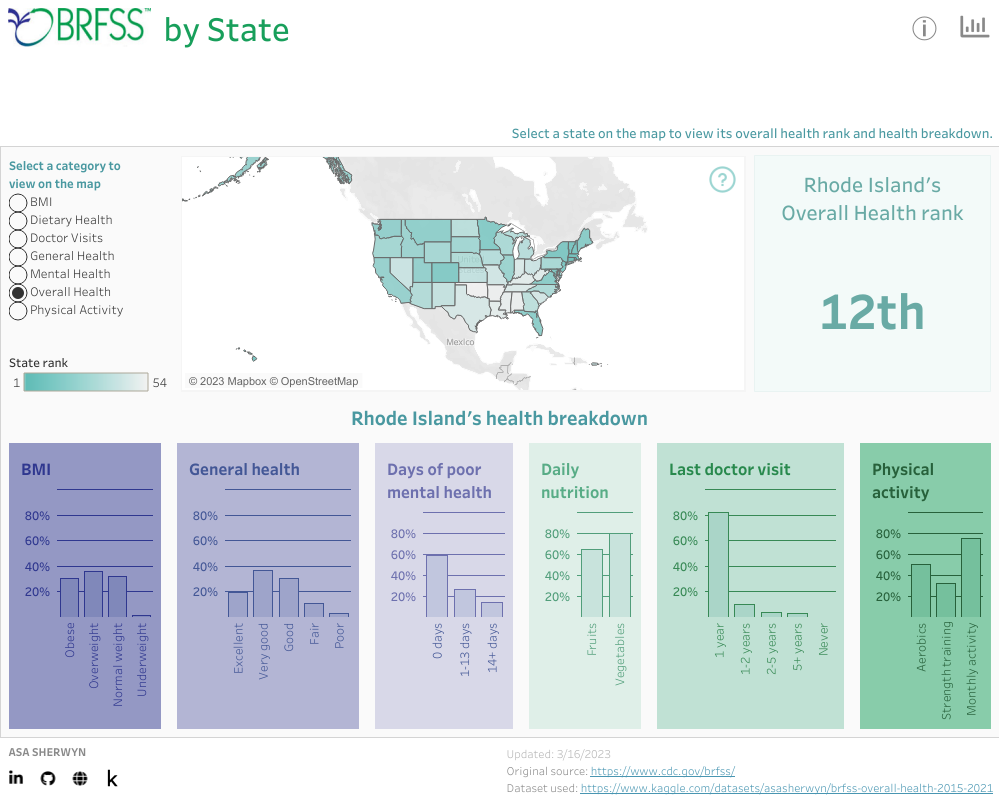
Healthcare providers, policy makers, and health-conscientious individuals need to know the basic health statistics of their states to make informed decisions. This Behavioral Risk Factor Surveillance System (BRFSS) is the premier source for these statistics. This project simplifies the BRFSS’s annual health survey data into easily understood dashboards and datasets.
Tools
Python, Jupyter notebooks, Tableau, MS Excel, MS PowerPoint, GitHub, Kaggle
Skills
Open sourcing, data manipulation, data sub-setting, data cleanine, data wrangling, data mapping, exploratory visual anlysis, correlation analysis, time-series analysis, geospatial analysis, linear regression, dashboard design
Objectives
- Transform the BRFSS data into a more accessible tabular dataframe.
- Create and upload subsets of the original data to facilitate public use.
- Provide current regionally relevant health metrics for healthcare professionals and policy makers.
- Create public dashboards explaining key BRFSS insights.
Process
Source a sufficiently robust set of public health records. Learn the variables' relationships to one another, their meaning, and significance. Keep a detailed project log of all steps taken in the analysis.
Data cleaning: remove irrelevant years, variables, topics, questions, and classes; validate data for type, range, consistency of expressions, and null values; standardize temporal variations.
Build a data dictionary to reduce dataset storage size and help ease of understanding.
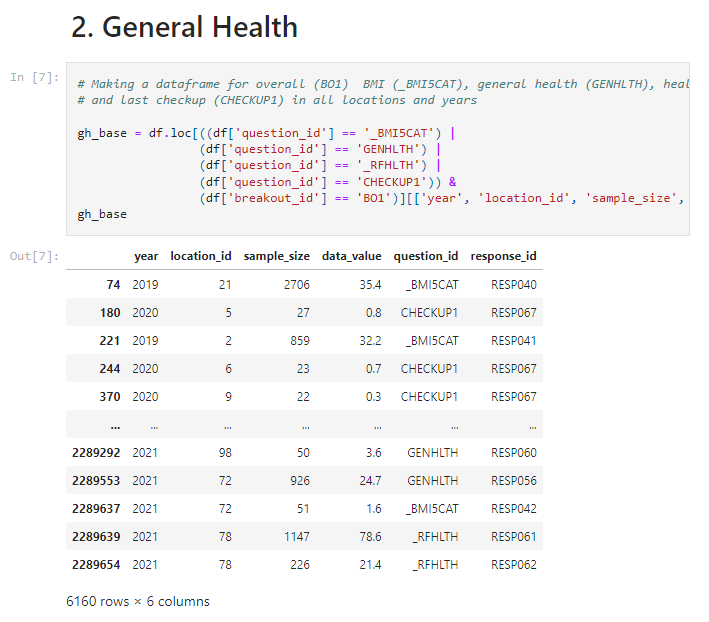 Wrangle the data into categorical health subsets via a standardized trnasformation process. The subset categories are: general health, dietary health, mental health, physical activity, and overall health.
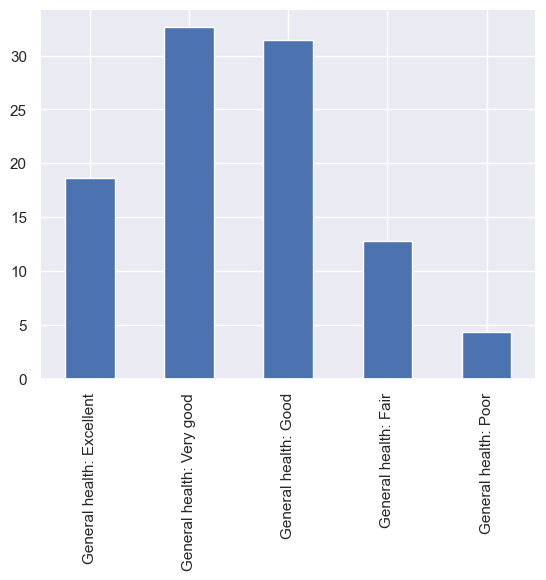 Establish national averages by calculating and plotting the summary statistics for each question response. This will provide a baseline to evaluate response averages on the international and the state levels.
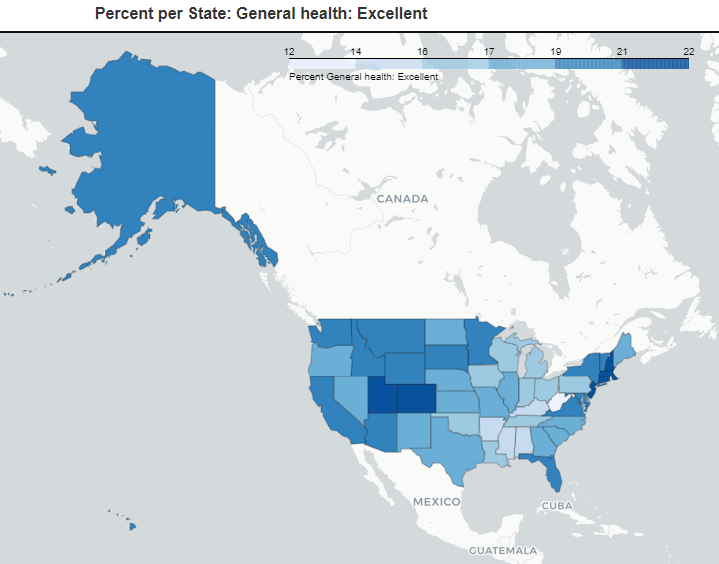 Examine geospatial trends on the state level in six key health categories. Writing custom plotting functions expedited the process of plotting choropleths for each response.
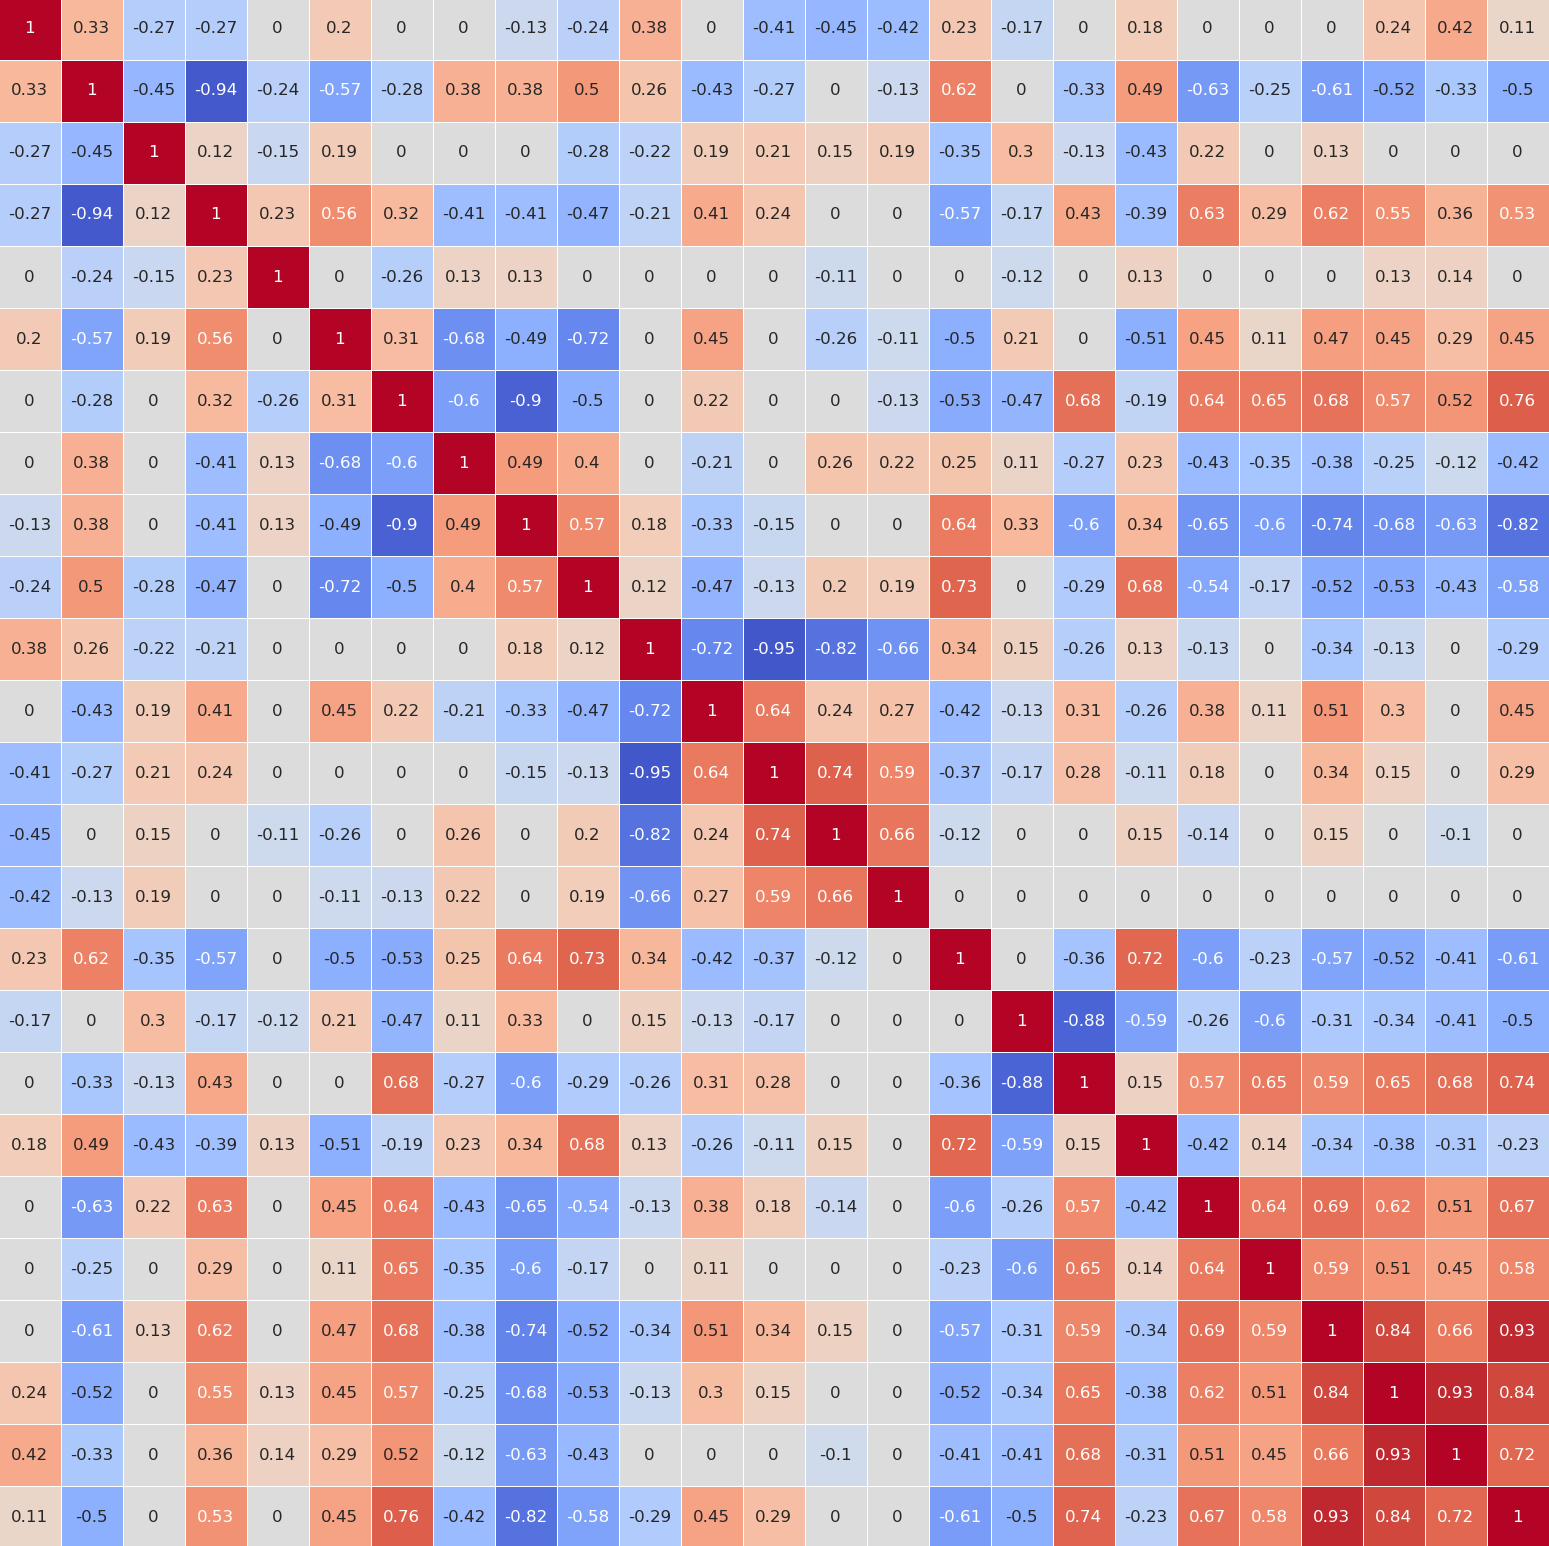 Plot correlation heatmaps in strong, medium, weak, and health category groups. The additional groupings help prioritize and direct subsequent steps of the analysis.
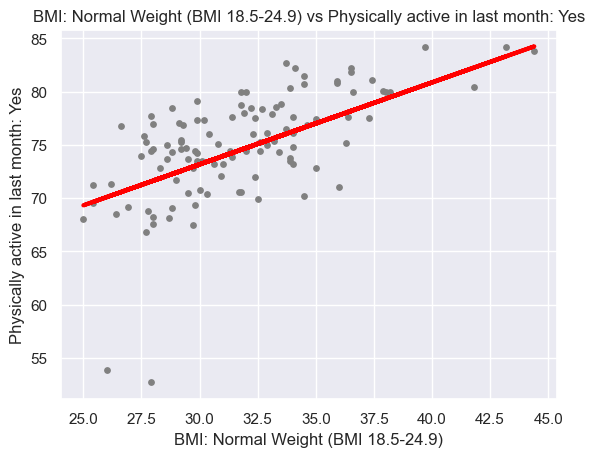 Linear regressions explored the predictability of variable pairs with strong correlative relationships. User defined functions expedited the process by revealing variable pairs with the strongest regression statistcs and rapidly plotting regessions for easy visual anlysis.
A time-series analysis highlighted which factors were improving over time and which were getting worse. This helped set a prioritize the dashboard building queue.
A formal ranking system let the results of the analysis be communicated and visualized more effectively. Multiple variables from each health category were weighted and combined to make the ranking system. States were ranked in six individual health categories and one combined overall category.
Linear regressions explored the predictability of variable pairs with strong correlative relationships. User defined functions expedited the process by revealing variable pairs with the strongest regression statistcs and rapidly plotting regessions for easy visual anlysis.
A time-series analysis highlighted which factors were improving over time and which were getting worse. This helped set a prioritize the dashboard building queue.
A formal ranking system let the results of the analysis be communicated and visualized more effectively. Multiple variables from each health category were weighted and combined to make the ranking system. States were ranked in six individual health categories and one combined overall category.
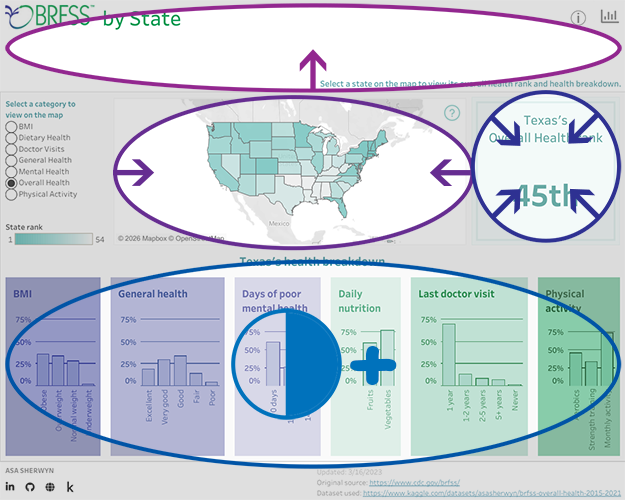
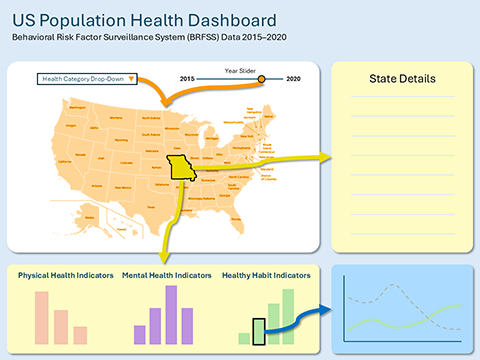
 The results from the analyses were compiled into visually compelling, interactive Tableau dashboards.
Insights
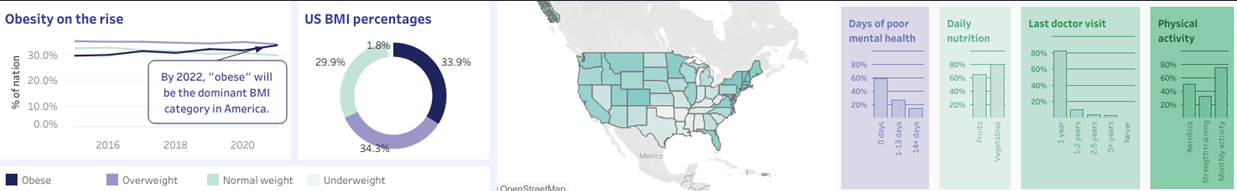
- 66% of Americans are overweight or obese and obesity rates are on the rise.
- 39% of Americans experience some mental health struggles.
- 24% of Americans are physically active less than once a month.
- The South ranks poorly for BMI, general health, mental health, dietary health, and physical activity.
Deliverables
Dashboards
Obesity in America
BRFSS by State
Data Subsets
Overall Health
General Health
Mental Health
Dietary Health
Physical Activity
Project Links
Project Log
Case Study
GitHub Repository
Data
Specs
- 2.29 million records by 27 variables
- 54 states, provinces, and territories
- 2011 - 2021
- Downloaded: 12/14/2022
Sources
Connecticut Residential Real Estate '11-'21
Summary
In the state of Connecticut, people sell approximately 40,000 residences totaling $14.8 billion, every year. Numerous factors contribute to the final selling prices of these residences. Being able to accurately predict a property's selling price can be a huge boon to sellers, buyers, realtors, and investors.
This analysis examines the impact of six individual variables on the closing sale amount of residential properties in Connecticut from 2011 to 2021.
This study then uses these findings to assess the effect of the COVID-19 pandemic on town and state level real estate trends.
Tools
Python, Jupyter notebooks, Tableau, MS Excel, MS PowerPoint, GitHub
Skills
Data storytelling, data manipulation, data cleaning, data wrangling, data merging, geospatial analysis, linear regression, k-means clustering, time-series analysis, dashboarding design, Consumer Price Index normalization
Objectives
Find out:
- What are the effects of a property’s assessed value, town, local population, selling month, selling year, and street number on its final selling price?
- When is the best time to sell a residence?
- Where do homes sell for the highest prices?
- Is the Connecticut real estate market going up or down?
- How has COVID-19 effected the market?
Process
Source reliable real estate records and begin a project log to keep a detailed account of all steps taken during the analysis.
Clean and wrangle the data for relevance and to normalize monetary values via the US Bureau of Labor and Statistics' Consumer Price Index.
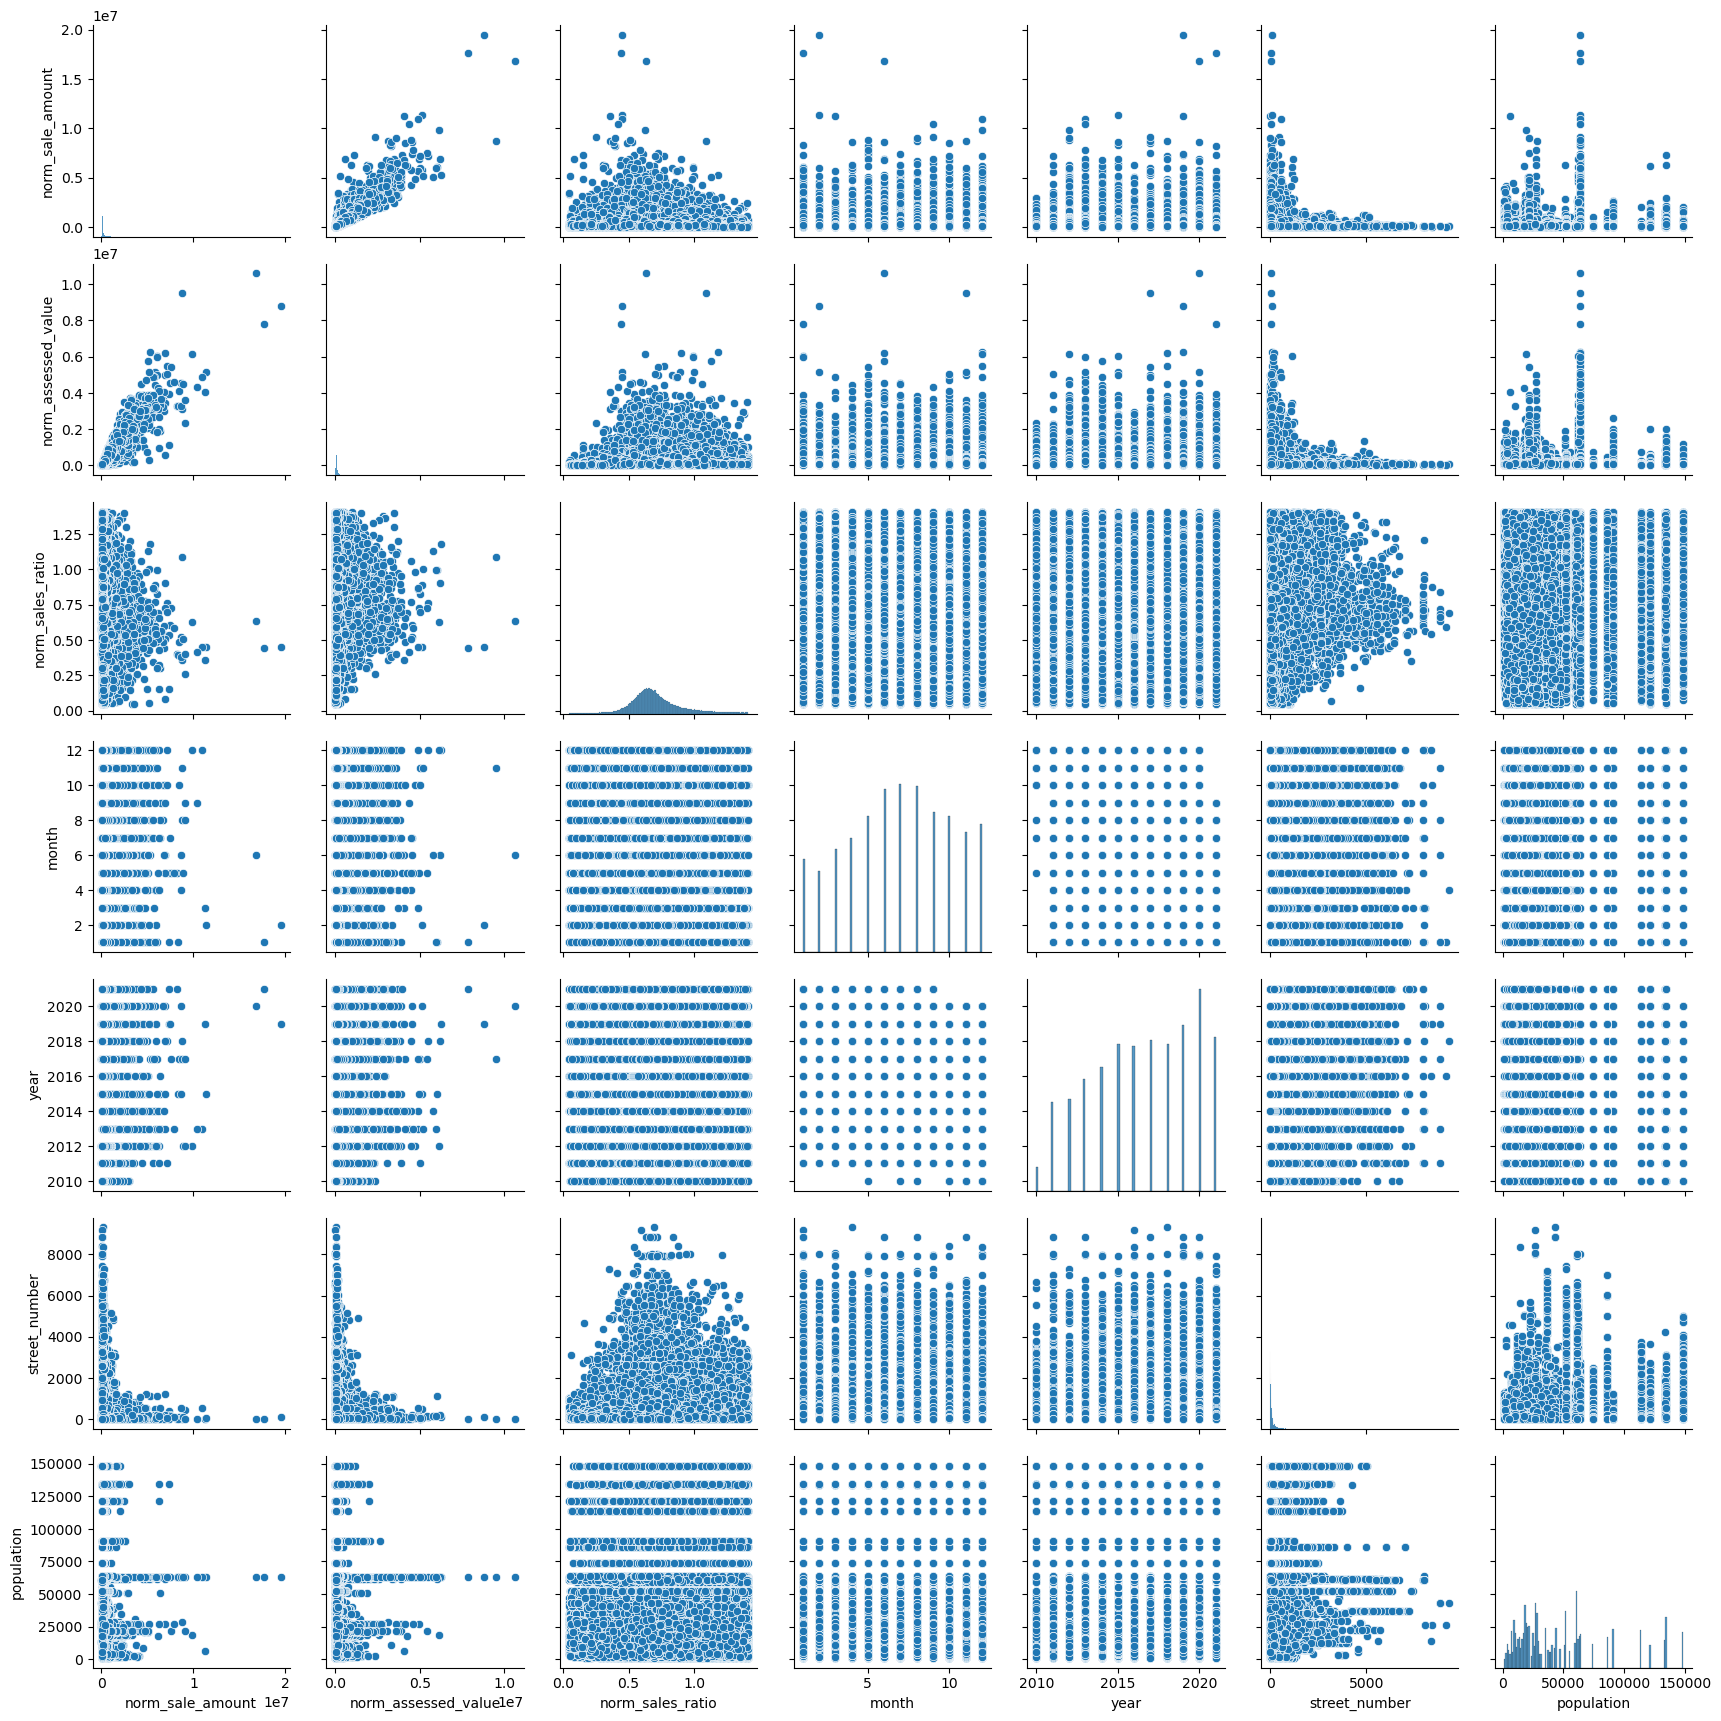 An exploratory visual analysis gave a basic understanding of the data and led to the hypothesis that as assessed value increases, so does the final selling price.
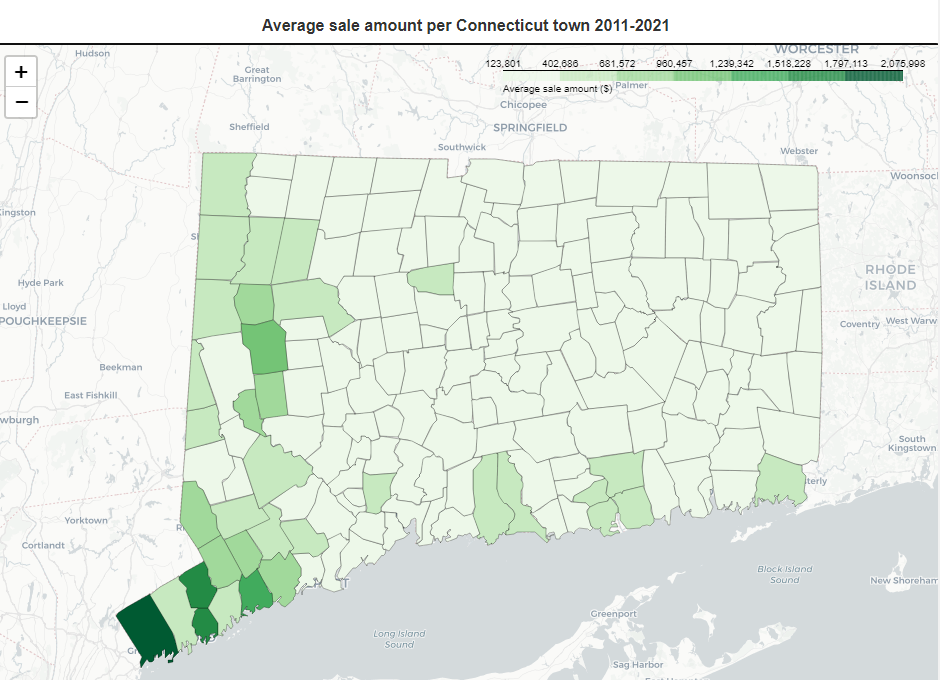 A geospatial analysis indicated that towns in the south-west corner of the state (nearest New York City) tend to have the largest sales, populations, and volume of sales.
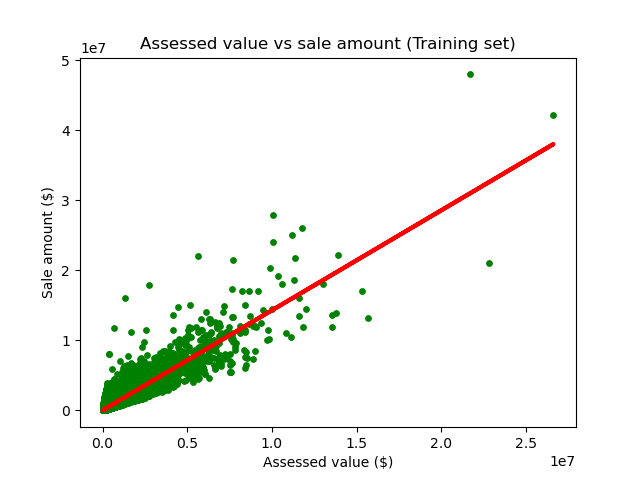 Linear regressions confirmed that a property's assessed value is a strong predictor of its final selling price.
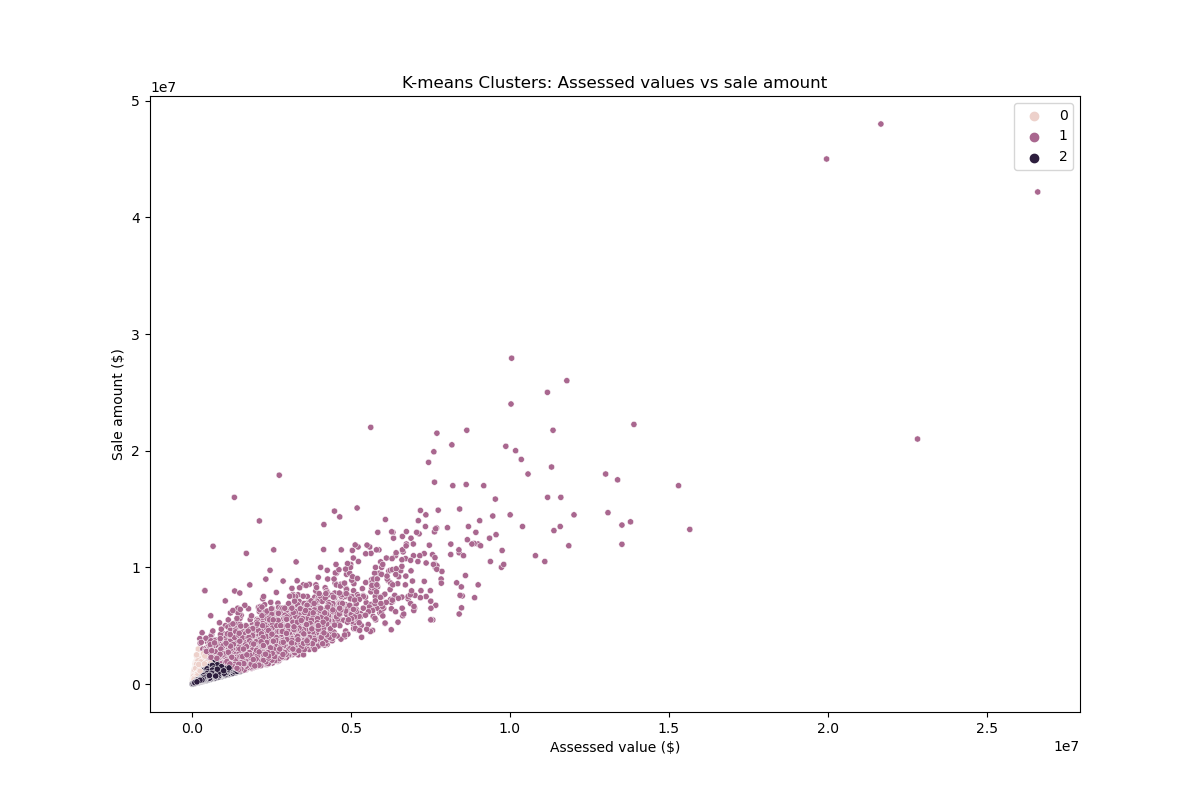 A k-means clustering algorithm revealed distinct trends for high and average valued properties.
The data was categorized into pre- or peri-pandemic groups to the effect of COVID-19 on the Connecticut real estate market.
A k-means clustering algorithm revealed distinct trends for high and average valued properties.
The data was categorized into pre- or peri-pandemic groups to the effect of COVID-19 on the Connecticut real estate market.
Insights
Deliverables
Tableau Storyboard
Case Study
GitHub Repository
Project Log
Data
Specs
- 430,492 records by 20 variables
- 169 towns
- 4 open-sourced datasets
- October 2010 to September 2021
Sources
Population Health Explorer
Summary
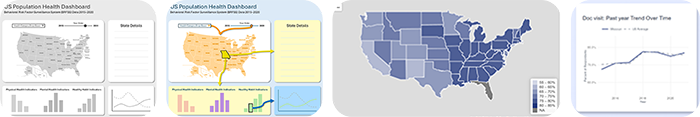
This project evolved an existing population health dashboard that struggled with low adoption due to usability challenges.
User surveys and heuristic evaluations revealed issues including an overly broad scope, confusing visual hierarchy, insufficient color contrast, and cognitive overload.
These findings fueled a dashboard redesign to simplify context, improve accessibility, and reduce visual complexity.
The final solution demonstrated measurable gains in engagement, sustained usage, and efficiency of user actions.
Tools
- Data visualization platform (Tableau and R Shiny)
- UX prototyping and wireframing tool (Figma and PowerPoint)
- User survey and feedback collection tool
- Accessibility contrast and color evaluation tools
Skills
- UX research and usability testing
- Heuristic evaluation
- Stakeholder communication and interaction mapping
- Data visualization and dashboard design
- Accessibility-first design
- Iterative product development
Objectives
- Identify causes of low dashboard adoption and engagement
- Reduce cognitive load and visual complexity
- Improve accessibility for users with visual impairments
- Align dashboard scope and content with primary user needs
- Increase efficiency and effectiveness of user workflows
Process
 Assessment & Research: Conducted heuristic evaluations and distributed a user survey to identify usability and accessibility issues.
 Synthesis & Prioritization: Analyzed feedback to isolate high-impact problems and prioritize improvements based on user needs and effort.
 Redesign & Iteration: Simplified dashboard scope, refined visual hierarchy, and adjusted color usage to improve clarity and contrast.
 Validation: Compared engagement, usage time, and task completion efficiency before and after implementation.
Insights
- Broad, multi-purpose dashboards can dilute clarity and reduce adoption when user goals are not clearly prioritized.
- Accessibility issues such as low contrast can significantly impact usability - even for users without identified impairments.
- Reducing visual density often improves both perceived and actual efficiency.
- Small, targeted UX changes can lead to outsized gains in engagement and effectiveness.
Deliverables
Redesigned population health dashboard
Updated visual and accessibility standards
Summary of user research findings and outcomes
Data
The dashboard leverages aggregated Behavioral Risk Factor Surveillance System (BRFSS) data to present population-level health indicators and trends. Data is structured to support comparative analysis across geographies and time while maintaining appropriate abstraction and avoiding exposure of any individual-level information.
Sales Targeting Suite
Out of respect for confidentiality and data governance requirements, this case study presents a high-level overview of the project. Certain examples and descriptions have been anonymized or generalized.
Summary
This project involved the design and continuous evolution of a sales-enablement dashboard suite intended to centralize fragmented operational and performance data into a single, actionable interface.
The solution translated complex metrics into intuitive visuals that supported decision-making across sales, presales, and actualization teams.
Through iterative UX design, stakeholder feedback, and usage analysis, the dashboards became embedded in daily workflows.
The final product significantly improved engagement resulting in a 1.5× increase in qualified leads in the first year and nearly a 3× increase by the second year.
Tools
- SQL (data extraction and transformation)
- Python (data processing and analysis)
- Business Intelligence platform (dashboarding and visualization)
- UX research tools (user testing, feedback collection)
- Version control and collaboration tools
Skills
- Dashboard design and data visualization
- Stakeholder communication and requirements gathering
- Empathy mapping and and usability testing
- Data modeling and metric definition
- Iterative product development
Objectives
- Consolidate siloed data sources into a unified reporting layer
- Simplify complex performance metrics into clear, actionable insights
- Increase adoption and daily usage among revenue-facing teams
- Improve lead qualification efficiency and downstream outcomes
Process
 Collaborated closely with sales, presales, and actualization stakeholders to understand their decision-making needs, pain points, and workflow constraints. These conversations helped surface inconsistencies in existing metrics, gaps in data accessibility, and opportunities to better support day-to-day actions across teams.
 Translated business goals into a clear set of standardized performance metrics and KPIs, ensuring alignment across teams and use cases. Designed an initial dashboard framework that balanced analytical depth with usability, focusing on clarity, hierarchy, and intuitive navigation.
 Conducted structured usability testing sessions and gathered ongoing qualitative feedback to evaluate how users interacted with the dashboards in real workflows. Observed friction points, measured comprehension, and identified opportunities to reduce cognitive load and improve interpretability.
 Refined visualizations, interactions, and underlying data models through multiple iteration cycles informed by user feedback and usage patterns. Improvements focused on simplifying complex logic, increasing performance, and ensuring that insights were immediately actionable.
 Rolled out dashboard updates incrementally and monitored adoption, engagement, and downstream impact over time. Used usage analytics and stakeholder feedback to guide continuous enhancements, ensuring the product remained relevant as business needs evolved.
Insights
- Reducing cognitive load in dashboards drives higher trust and adoption than adding more metrics.
- Consistent metric definitions across teams are critical for alignment and decision-making.
- User feedback early and often prevents costly redesigns later in the lifecycle.
- Dashboards are most effective when embedded directly into existing workflows.
Deliverables
Production-ready, sales-enablement dashboard suite
Standardized performance metrics and definitions
UX-tested visual layouts optimized for daily use
Documentation supporting ongoing iteration and scalability
Data
The dashboards were built on aggregated operational, performance, and engagement data sourced from internal and external systems. Data included time-series metrics, categorical performance indicators, and activity-based signals relevant to revenue operations. All data was transformed and modeled to support consistent definitions, trend analysis, and cross-functional reporting while adhering to internal governance and confidentiality constraints.
OnyxInsights
Out of respect for confidentiality and data governance requirements, this case study presents a high-level overview of the project. Certain examples and descriptions have been anonymized or generalized.
Summary
OnyxInsights is the flagship business intelligence platform for Onyx CenterSource, designed to transform complex hospitality payment, booking, and commission data into benchmark-driven insights.
I entered the project mid-way through wireframing and led the end-to-end development of production dashboards, data models, and visualizations, while supporting product positioning and market entry.
Through iterative UX testing, client customization, and close collaboration with sales and product teams, the platform evolved into a scalable, client-ready analytics solution.
OnyxInsights enables hospitality and travel organizations to benchmark performance, uncover growth opportunities, and make more confident, data-driven decisions.
Tools
- SQL (data modeling, transformation, and aggregation)
- Python (data processing, validation, forecasting, and anonymization)
- Business Intelligence platform (dashboard and visualization development)
- UX research tools (user testing, feedback collection)
- Presentation and design tools (sales enablement and marketing materials)
Skills
- Data visualization and analytical storytelling
- Product analytics and dashboard architecture
- UX testing and iterative design
- Stakeholder collaboration and client communication
- Go-to-market and sales enablement support
Objectives
- Translate complex hospitality payment and booking data into actionable insights
- Enable confident benchmarking across markets, segments, and peers
- Support strategic and operational decision-making for hotels and travel agencies
- Create a scalable, customizable BI product aligned with industry needs
Process
 Product Immersion and Design Continuation: Integrated into the project following early user research, refining and completing wireframes to ensure clarity, usability, and scalability across dashboards.
 Dashboard and Data Development: Built production-ready dashboards, data sources, and visualizations that transformed normalized payment and booking data into benchmark-focused insights.
 UX Testing and Iterative Enhancement: Ran multiple rounds of usability testing and incorporated client and internal feedback to improve comprehension, performance, and workflow integration.
 Client Customization and Enablement: Delivered bespoke reporting variations for clients while maintaining product consistency, and trained sales teams on product functionality and value propositions.
 Market Support and Ongoing Optimization: Contributed to packaging, marketing, and thought leadership content while supporting continuous product refinement informed by client outcomes and industry trends.
Insights
- Benchmarking is most effective when paired with clear contextual explanations and recommended actions.
- Hospitality users value trust, clarity, and consistency over overly complex analytical depth.
- Customization must balance flexibility with strong core product standards to remain scalable.
- BI products gain credibility when insights are tightly connected to real operational outcomes.
Deliverables
Production-ready, BI platform
Client-ready visualizations and reporting frameworks
Sales enablement and thought leadership materials
Benchmark-driven dashboards and standardized performance metrics
Data
OnyxInsights leverages aggregated, anonymized hospitality payment, booking, commission, and performance data sourced from connected operational systems. Data is ingested, normalized, enriched, and modeled to support accurate benchmarking across markets and segments. The resulting datasets enable trend analysis, peer comparison, and performance evaluation while adhering to strict confidentiality and data governance standards.
Health Seminar Virtualization
Out of respect for confidentiality and data governance requirements, this case study presents a high-level overview of the project. Certain examples and descriptions have been anonymized or generalized.
Summary
When the pandemic abruptly shut down in-person wellness seminars, a health and wellness organization faced significant financial risk due to grant dependencies. Rapidly transformation of live sessions into virtual programs, procuring AV equipment, onboarding replacement instructors, and training staff for effective virtual delivery.
Key challenges included accommodating participants with learning disabilities, mental health concerns, and technophobia while maintaining engagement and educational outcomes.
Within 27 days, the virtual program launched successfully, ensuring continuity of services, broadening audience reach, and creating a foundation for future virtual engagement.
Tools
- Zoom (video conferencing and live streaming)
- Learning management system
- Audio-visual recording and editing equipment
- Asana for project management and workflow
Skills
- Rapid product design and iteration
- UX design focused on accessibility and engagement
- Staff training and digital adoption
- Project management under tight deadlines
- Stakeholder and community communication
Objectives
- Preserve revenue streams tied to grant fulfillment
- Convert in-person wellness seminars to an engaging virtual format
- Ensure accessibility for participants with diverse learning and technological abilities
- Quantify long-term scalability and reach of virtual wellness programming
Process
 Assessment & Planning: Identified critical seminar content, participant needs, and technology requirements.
 Content & Delivery Conversion: Adapted multi-day seminars into virtual-friendly formats, including live and recorded sessions.
 Staff Enablement: Trained instructors on AV equipment, virtual facilitation techniques, and accessibility best practices.
 Pilot & Launch: Conducted test sessions, refined delivery based on feedback, and launched the program within 27 days.
Monitoring & Iteration: Collected participant feedback and engagement metrics to inform future virtual programming.
Pilot & Launch: Conducted test sessions, refined delivery based on feedback, and launched the program within 27 days.
Monitoring & Iteration: Collected participant feedback and engagement metrics to inform future virtual programming.
Insights
- Rapid digital adoption is possible even for participants with technophobia when support and simplicity are prioritized.
- Maintaining educational outcomes requires intentional design for engagement and accessibility.
- Small, remote organizations can scale reach and impact through virtual program delivery.
- Crisis-driven innovation can uncover long-term operational efficiencies.
Deliverables
Fully functional virtual wellness program
Recorded and live-streamed seminar content
Staff training materials and AV operation guides
Participant engagement and accessibility support guides
Metrics dashboard tracking attendance and engagement
Rural Transit Ride Tracking System
Out of respect for confidentiality and data governance requirements, this case study presents a high-level overview of the project. Certain examples and descriptions have been anonymized or generalized.
Summary
While working in rural Alaska, I served as lead designer and project manager on a proprietary ride tracking system for a transit cost-share program supporting individuals with mental illnesses and cognitive disabilities.
Existing paper-based tracking methods were error-prone and cognitively demanding for drivers, resulting in incomplete records, lost funding, and operational strain.
Through participatory design with drivers and coordination with engineering partners, we delivered a simplified in-vehicle form paired with an auto-correcting, locally stored data entry system.
The redesigned workflow dramatically improved data quality, reduced driver effort, and stabilized both program funding and staffing.
Tools
- Low-fidelity and paper prototyping tools
- Python (local data storage and validation logic)
- Lightweight relational database (locally hosted)
- Excel for validation and reconciliation testing
Skills
- Human-Centered Design
- Accessibility-first UX design
- Participatory and contextual research
- Systems thinking
- Cross-functional project leadership
Objectives
- Reduce cognitive load and manual effort for drivers with learning and mental impairments
- Improve accuracy and completeness of ride tracking data
- Minimize administrative reconciliation time and costs
- Increase cost-share reimbursement recovery
- Improve driver satisfaction, retention, and program sustainability
Process
 Contextual Research & Stakeholder Interviews: Conducted field research with drivers and program staff to understand cognitive, environmental, and workflow constraints in real driving conditions.
 Task Simplification & Accessibility Mapping: Identified points of friction in existing logs and redesigned tasks to minimize reading, writing, and memory demands.
 Iterative Prototyping & Validation: Tested simplified in-vehicle forms and data entry workflows with drivers, refining based on usability feedback and observed errors.
 System Integration & Error Correction Design: Collaborated with engineering partners to implement a locally stored, auto-completing system that corrected common duration and distance inconsistencies.
 Pilot Deployment & Outcome Measurement: Rolled out the solution incrementally, monitoring adoption, data quality, reimbursement rates, and operational workload.
Insights
- Accessibility is operational efficiency: Designing for cognitive accessibility directly improved data accuracy and financial outcomes.
- Error tolerance matters more than error prevention: Systems that gracefully correct mistakes are more effective than those that demand perfection from users.
- Contextual constraints drive design: In-vehicle environments require radically different UX assumptions than desk-based systems.
- Human-centered design reduces burnout: Simplifying workflows can have measurable impacts on staff retention and morale.
Deliverables
Simplified, accessible in-vehicle ride tracking form
Locally hosted, Python-based data entry and validation system
Streamlined end-of-shift data entry workflow with auto-correction logic for ride duration and distance inconsistencies
Internal documentation for operations and maintenance
Data
The system captured structured ride-level data, including timestamps, stop counts, passenger information, and trip durations. Data was stored locally to ensure reliability in low-connectivity environments and validated through automated logic to flag and correct common inconsistencies. All data handling followed program-level privacy and compliance requirements, with no personally identifiable information exposed outside the system.
Instacart Basket Analysis
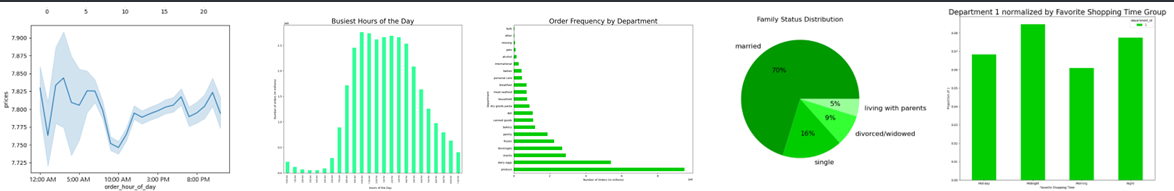
This page is under construction. Please check back later.
Rock Buster Stealth LLC
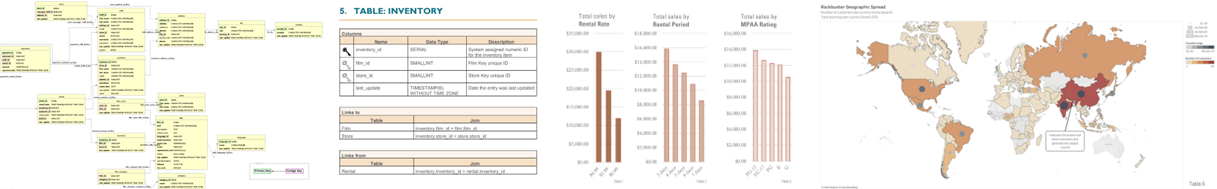
This page is under construction. Please check back later.
Medical Staffing Agency
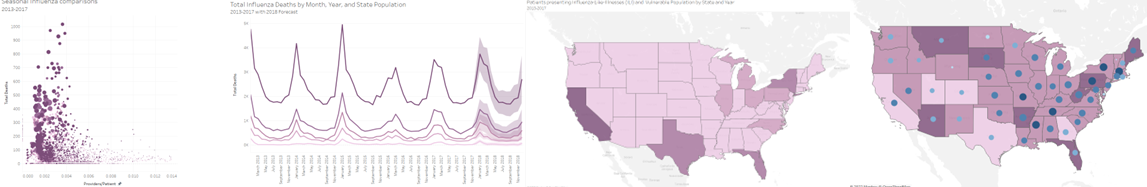
Summary
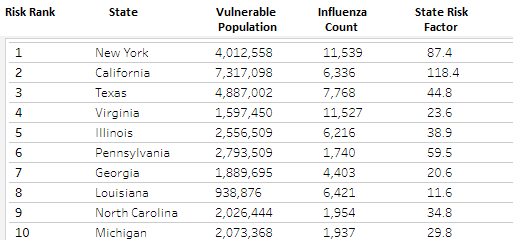
A medical staffing agency, that provides temporary workers to clinics and hospitals on an as-needed basis, sought help navigating the flu season. They requested staffing guidelines that would keep under and over staffing within 10% of optimal staff-to-patient ratios in each of the 50 US states. A synthesis of CDC and US Census Bureau records led to an interactive forecasting dashboard.
Tools
MS Excel, Tableau
Skills
Business requirements document, requirements gathering, data cleaning, data integration, data transformation, statistical hyptothesis testing, exploratory visual analysis, forecasting, dhashboard design, storyboard design, video presentation
Objectives
- Provide information to support a staffing plan, detailing what data can help inform the timing and spatial distribution of medical personnel throughout the United States.
- Determine whether influenza occurs seasonally or throughout the entire year. If seasonal, does it start and end at the same time (month) in every state?
- Prioritize states with large vulnerable populations.
- Assess data limitations.
Process
Translate the agency's BRD into questions and deliverables.
Clean, combine, and assess the relevant datasets.
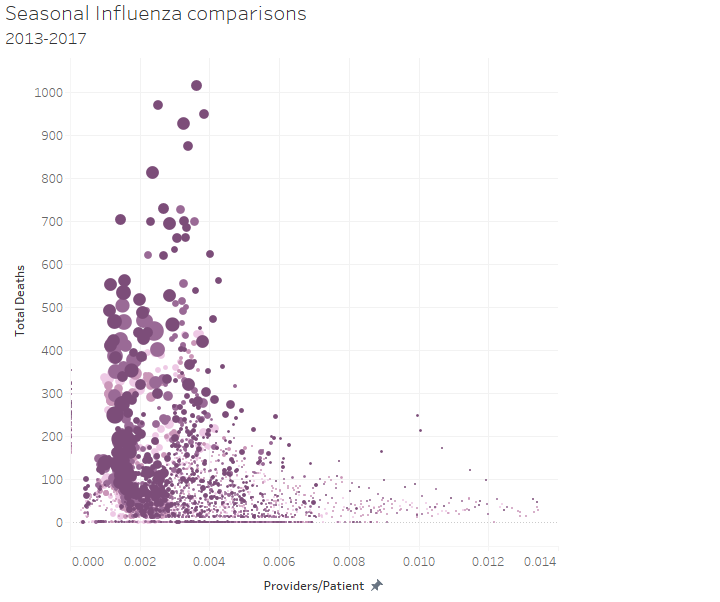 Create a scatter plot check the theory that ideal staffing ratios help reduce influenza mortality rates. Then validate the theory with a statistical hypothesis test.
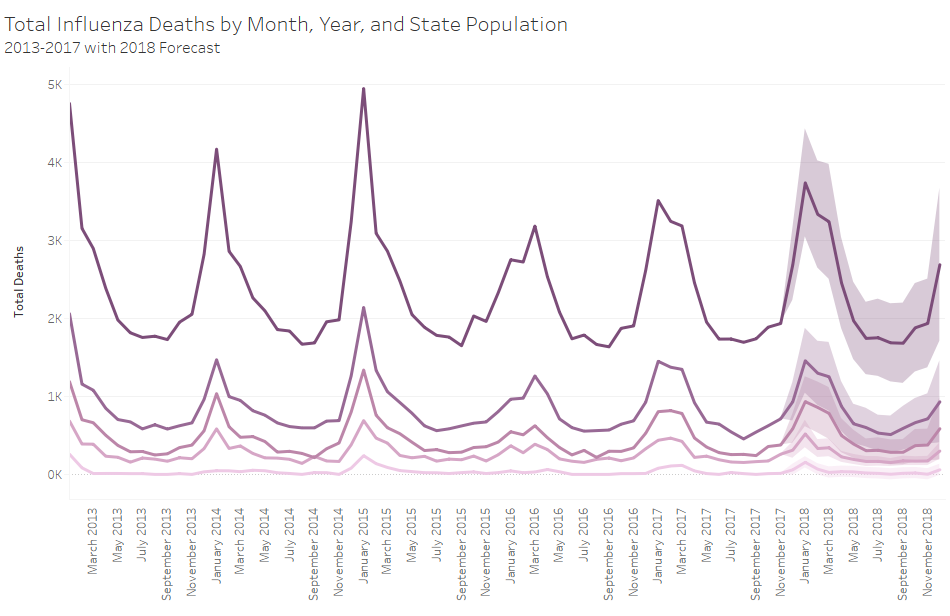 Conduct a time series analysis to check for seasonality in influenza contraction and mortality rates.
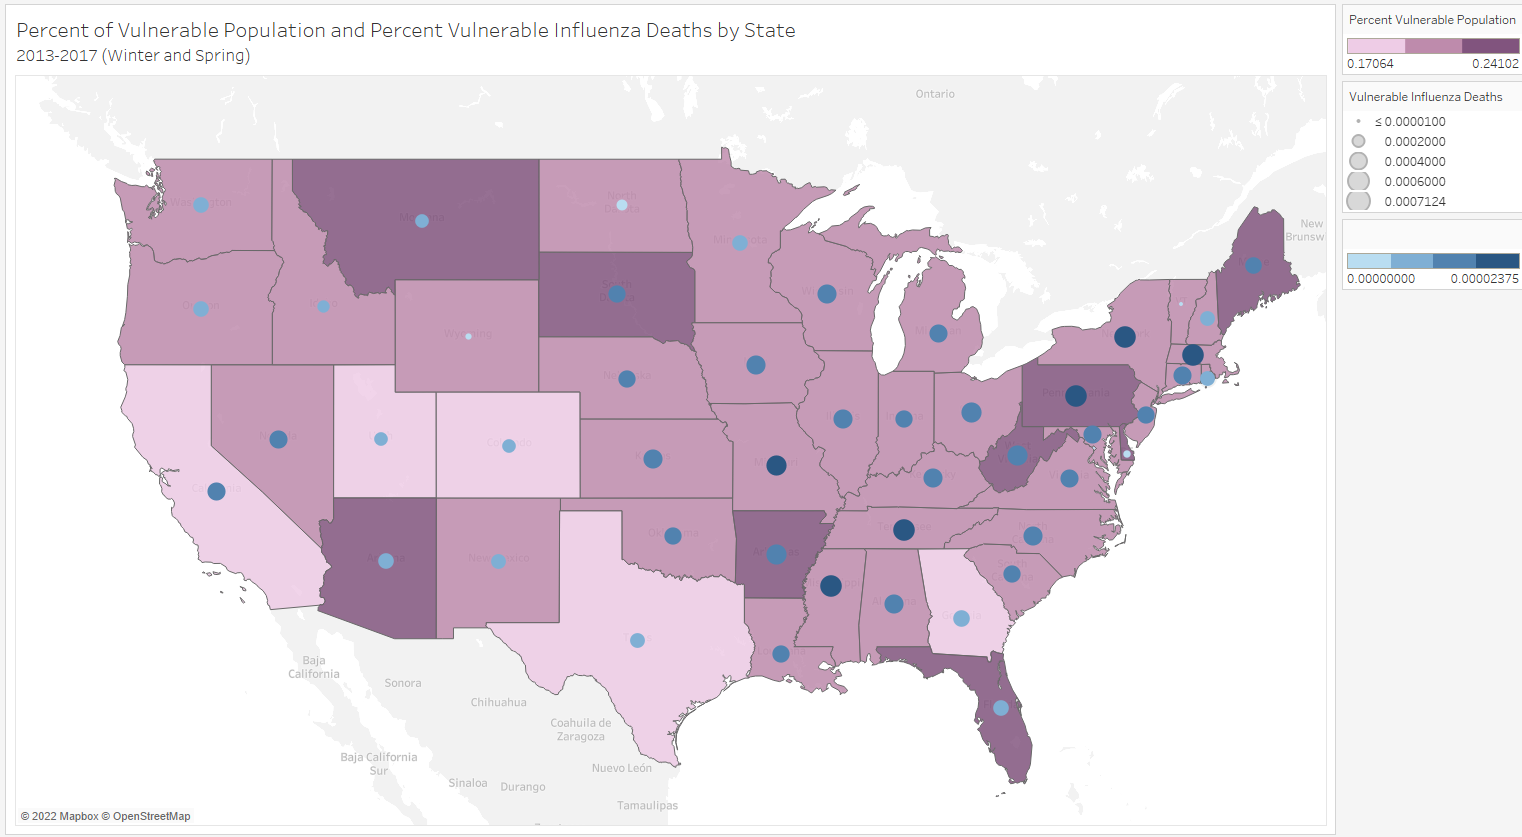 Examine geospatial trends in influenza contraction and mortality rates via choropleths.
 Compile all findings into a prioritize list of states that can be adjusted for time of year.
 Build a compelling storyboard with interactive dashboards to fulfill the medical staffing agency's requirements.
Insights
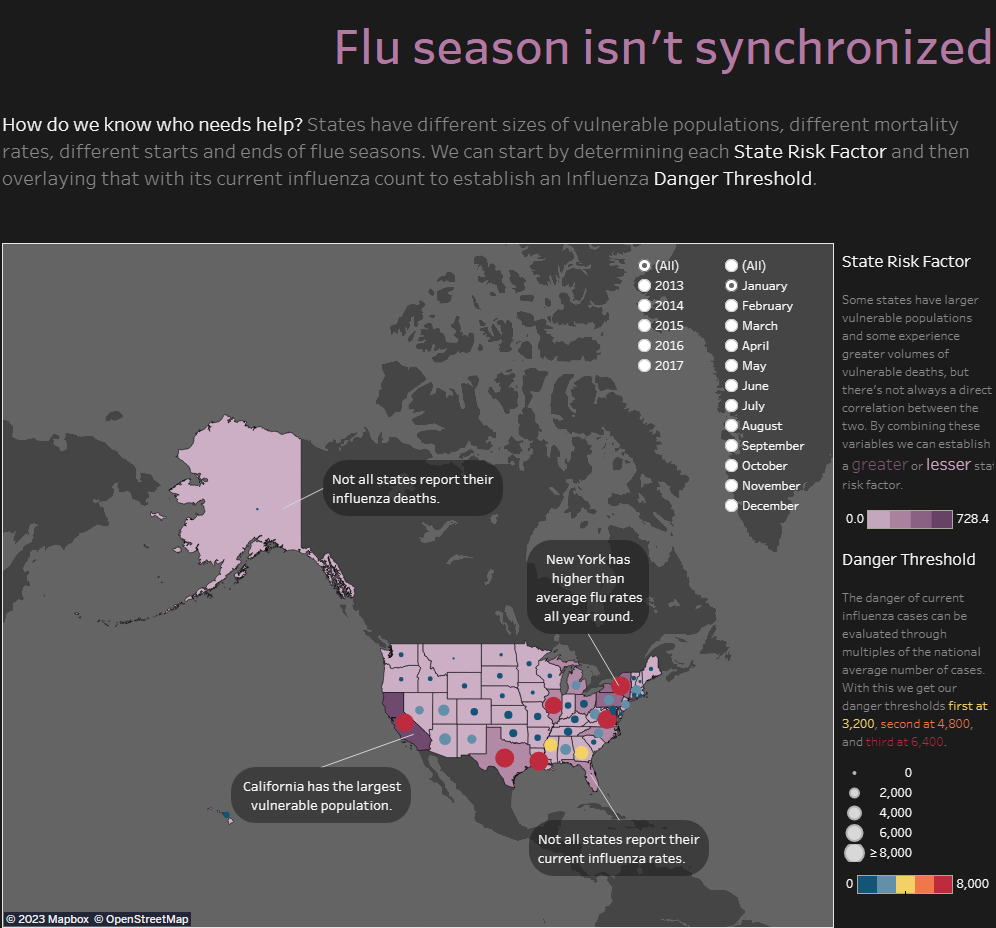
- A state's staffing priority depends on its current influenza count and its average vulnerable population size.
- Flu season peaks in January is elevated from November through April.
- California, Texas, Florida, and New york have the largest average vulnerable populations.
- Alaska, Delaware, and Florida have not provided enough data to be accuaretly assessed.
Deliverables
Case study Tableau Storyboard
Data
GameCo
Summary
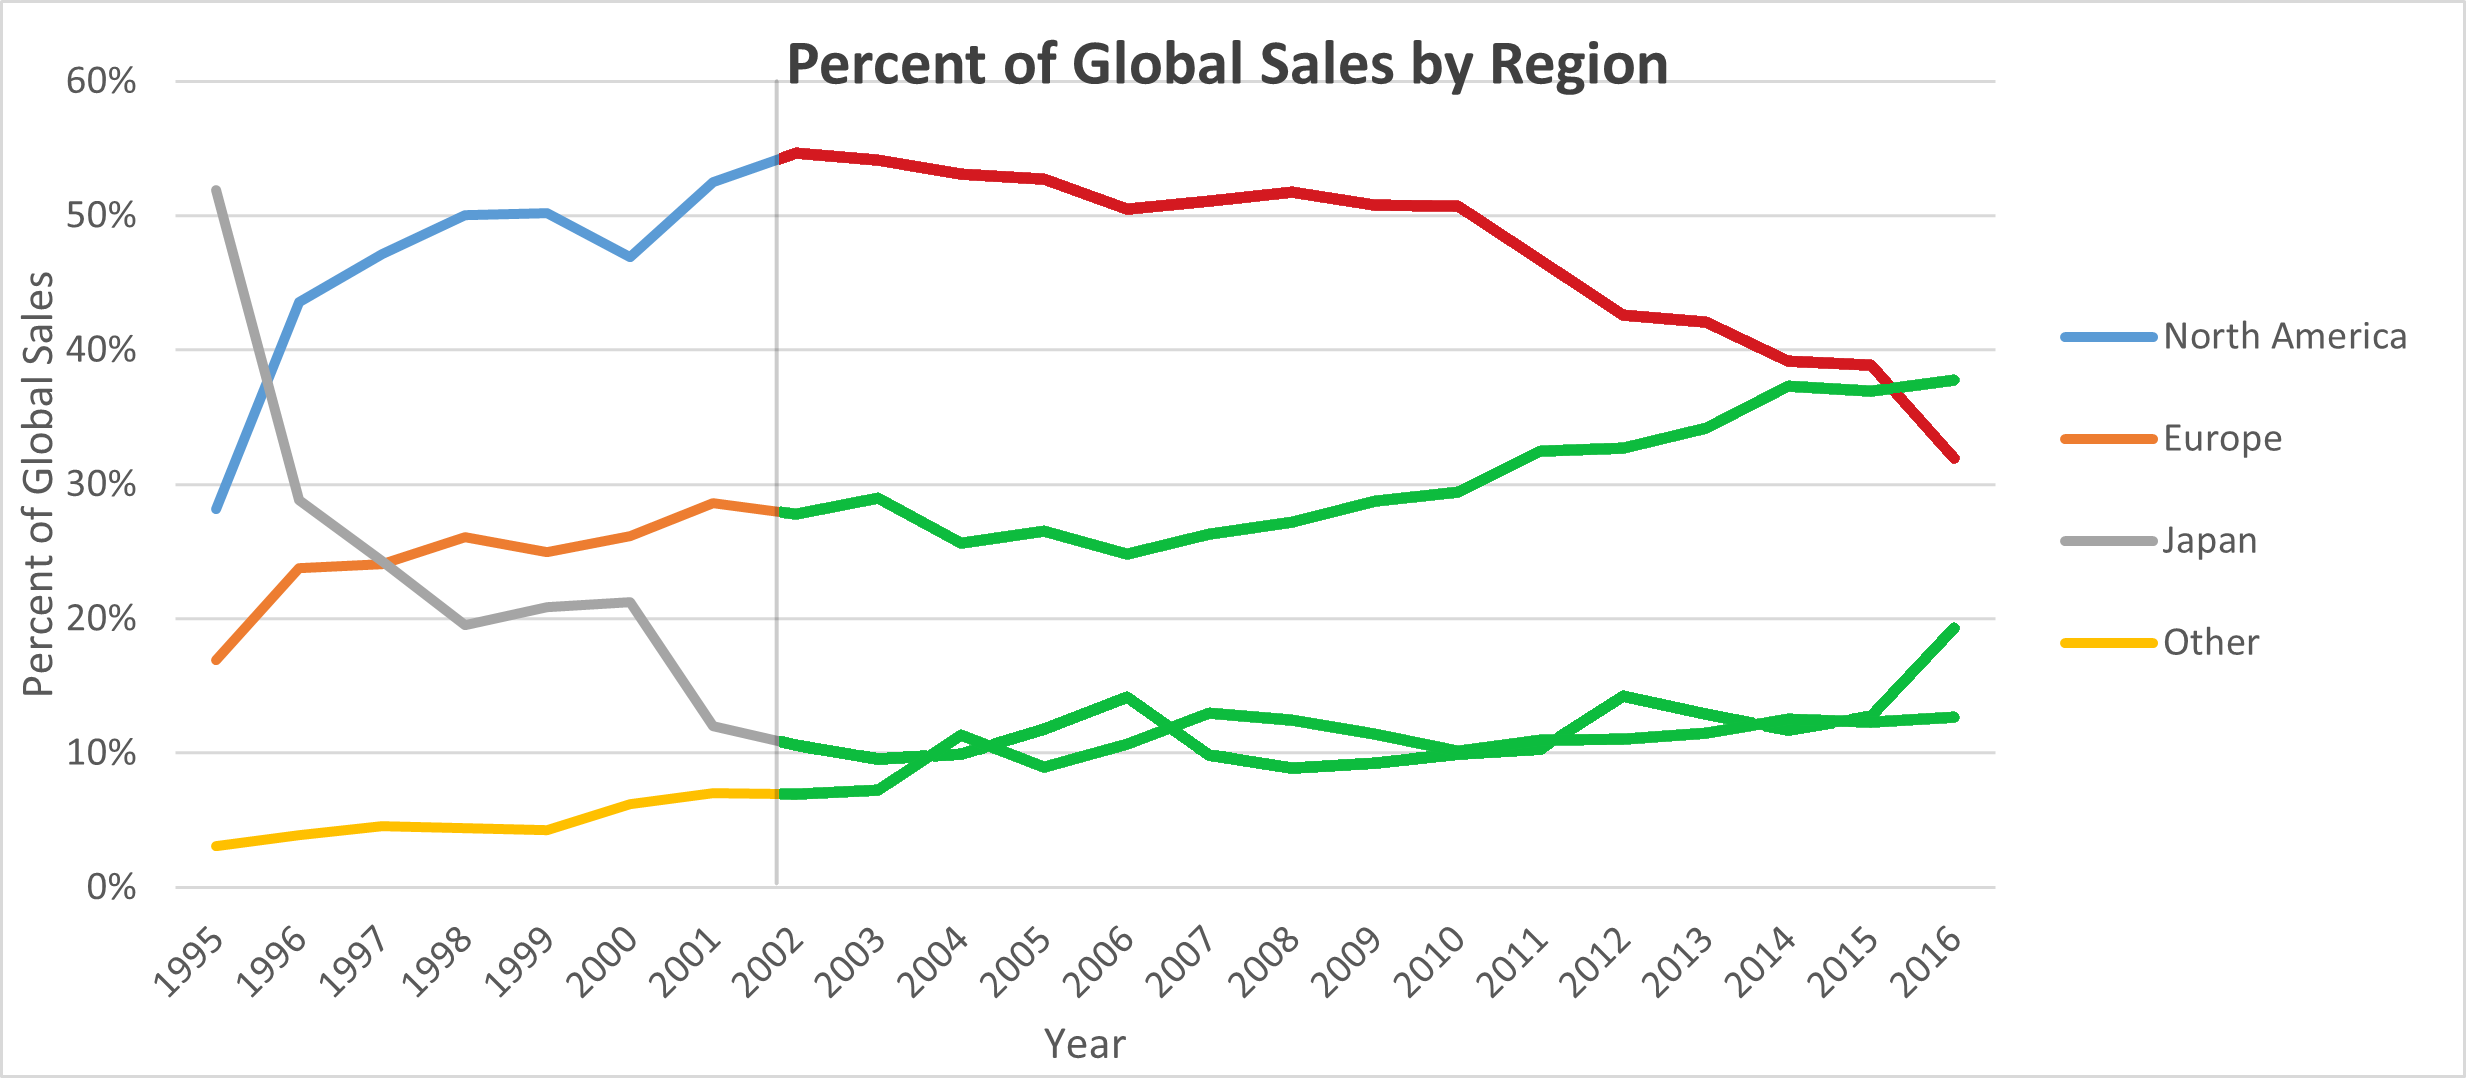
GameCo, a new video game company, needed updated insights into the gaming industry to direct the development of their products. They requested a descriptive analysis of historic video game sales across major regional markets. The project resulted in a report that provided summary details of the market, findings that challeneged their current understanding of the industry, and actionable insights to help them succeed.
Tools
MS Excel, MS Powerpoint
Skills
Data profiling, data cleaning, data visualization, data reporting, pivot tables, statistical analysis, descriptive analysis, trend forecasting.
Objectives
Find out:
- If some types of games are more popular than others.
- Have any games changed in popularity over time.
- How have sales varied by region over time.
Process
Refining questions and answers were exhcanged with the stakeholders to pinpoint the desired deliverables.
The data was cleaned, removing or imputing values for incomplete records, unifying categorical values, and reducing the number of years for relevance.
 Pivot tables aggregated information to give a clear understanding of the data and help create visualzations.
 The key findings and visualizations were compiled into a compelling stakeholders' report.
Insights
- Popularity of genres varies strongly by region. Overall, action, shooter, and sports games are currently the most popular.
- Puzzle, racing, simulation, and strategy games have been decreasing in popularity.
- Action, shooter, and sports games have been increasing in popularity.
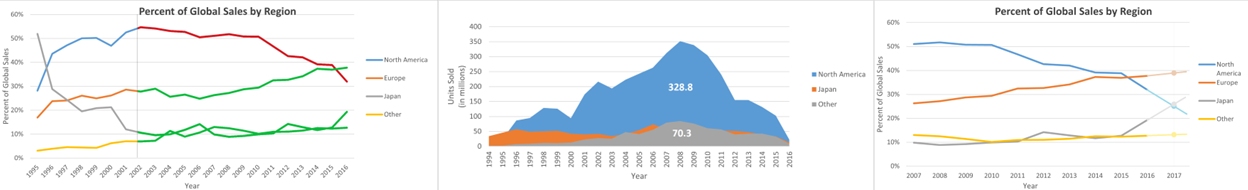
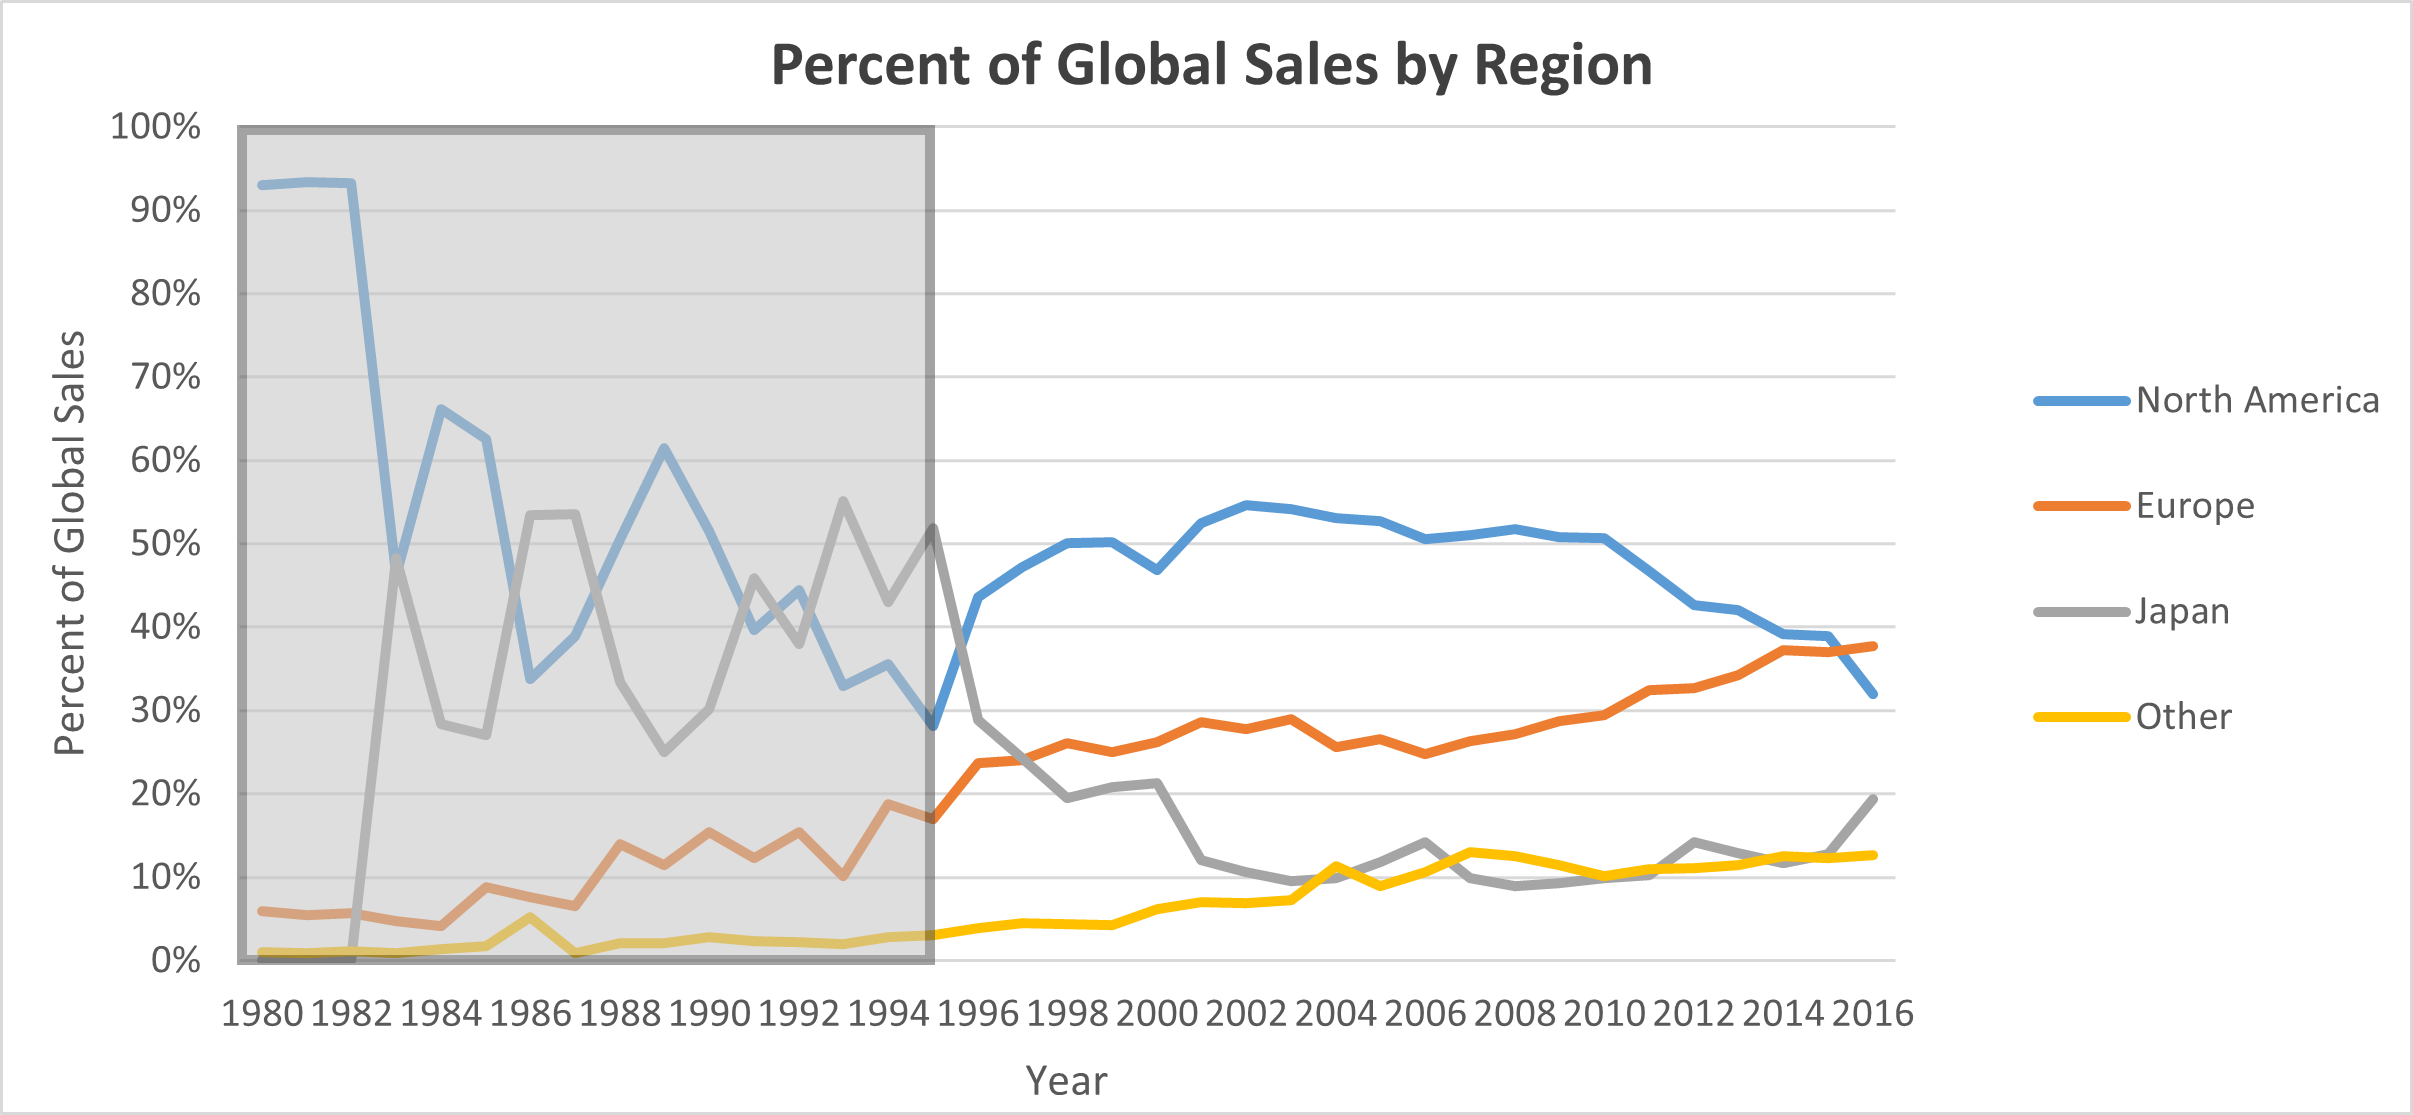
- Most sales during the 2000s have been in North America, but North American sales have been in decline since 2002.
- In 2015 Europe surpassed North America as the market leader.
- All markets have saw a massive decline in sales from 2008 to 2016.
Deliverables
Case study Report
Data
- Records of videogame sales over 100,000 units
- From 1980 to 2016
- Final dataset: 16,590 records and 10 variables
- Original data from VGChartz.com
Xyz

Summary
xyz
Tools
x, y, z
Skills
x, y, z
Objectives
Find out:
Process
x
x
 x
x
x
Insights
Deliverables
Data
Elements
Text
This is bold and this is strong. This is italic and this is emphasized.
This is superscript text and this is subscript text.
This is underlined and this is code: for (;;) { ... }. Finally, this is a link.
Heading Level 2
Heading Level 3
Heading Level 4
Heading Level 5
Heading Level 6
Blockquote
Fringilla nisl. Donec accumsan interdum nisi, quis tincidunt felis sagittis eget tempus euismod. Vestibulum ante ipsum primis in faucibus vestibulum. Blandit adipiscing eu felis iaculis volutpat ac adipiscing accumsan faucibus. Vestibulum ante ipsum primis in faucibus lorem ipsum dolor sit amet nullam adipiscing eu felis.
Preformatted
i = 0;

while (!deck.isInOrder()) {
    print 'Iteration ' + i;
    deck.shuffle();
    i++;
}

print 'It took ' + i + ' iterations to sort the deck.';
Lists
Unordered
- Dolor pulvinar etiam.
- Sagittis adipiscing.
- Felis enim feugiat.
Alternate
- Dolor pulvinar etiam.
- Sagittis adipiscing.
- Felis enim feugiat.
Ordered
- Dolor pulvinar etiam.
- Etiam vel felis viverra.
- Felis enim feugiat.
- Dolor pulvinar etiam.
- Etiam vel felis lorem.
- Felis enim et feugiat.
Icons
Actions
Table
Default
| Name |
Description |
Price |
| Item One |
Ante turpis integer aliquet porttitor. |
29.99 |
| Item Two |
Vis ac commodo adipiscing arcu aliquet. |
19.99 |
| Item Three |
Morbi faucibus arcu accumsan lorem. |
29.99 |
| Item Four |
Vitae integer tempus condimentum. |
19.99 |
| Item Five |
Ante turpis integer aliquet porttitor. |
29.99 |
|
100.00 |
Alternate
| Name |
Description |
Price |
| Item One |
Ante turpis integer aliquet porttitor. |
29.99 |
| Item Two |
Vis ac commodo adipiscing arcu aliquet. |
19.99 |
| Item Three |
Morbi faucibus arcu accumsan lorem. |
29.99 |
| Item Four |
Vitae integer tempus condimentum. |
19.99 |
| Item Five |
Ante turpis integer aliquet porttitor. |
29.99 |
|
100.00 |

