About Me

Hi! I'm Asa, a data analyst with experience in project management, healthcare, art, and education. My career path has been winding, adventurous, and fortuitous.
I built my first computer at 13. I aced my AP computer science exam at 17. I could effortlessly carve my way through statistics and physics by 18. My path to the data sciences stood clearly before me.
And then I made a hard left. Feeling confined by the limits of expression and exploration afforded to the technologically minded, I fled to the arts.
There I fell in good company with pioneers expanding the range and depth of communication. Pioneers like Joseph Kosuth who taught me that an idea is more vast than any and all combinations of its literal, figurative, or physical representations.
Ironically enough, my pursuit of artistry slowly turned into a pursuit of credible communication which then slowly returned me to the data sciences. 10 years ago, amid an icy Alaska winter, I had my first confused adventure in data investigation. A relentless barrage of lessons in dirty data evolved into a decade of discovery, of erudition. Today I delight in parsing together seemingly incongruous droves of information and distilling them into troves of elegantly visualized actionable insights.
My tools of choice are SQL (PostgreSQL and MySQL) Python, Tableau, and Microsoft Excel. If you’re looking for a self-motivated, quick-learning problems solver with a knack for artistic communication, don’t hesitate to reach out.
Columbia, MO | Remote
Projects
[Click a project's title or image to learn more]
Behavioral Risk Factor Surveillance System
 Transforming oblique health survey records into accessible public dashboards. I cleaned, wrangled, and analyzed the BRFSSs’ 2.3 million records to help increase awareness of health trends across the nation.
Connecticut Residential Real Estate '11-'21
Transforming oblique health survey records into accessible public dashboards. I cleaned, wrangled, and analyzed the BRFSSs’ 2.3 million records to help increase awareness of health trends across the nation.
Connecticut Residential Real Estate '11-'21
 Assessing real estate trends and COVID-19 impacts on the Connecticut housing market. This project examines the impact of 6 variables on the final selling price of residential properties in Connecticut from 2011 to 2021.
Instacart Basket Analysis
Assessing real estate trends and COVID-19 impacts on the Connecticut housing market. This project examines the impact of 6 variables on the final selling price of residential properties in Connecticut from 2011 to 2021.
Instacart Basket Analysis
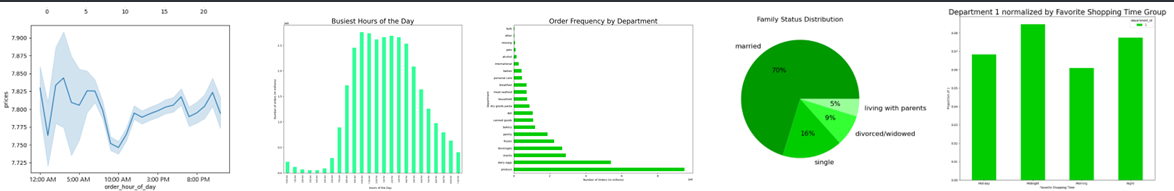 An analysis of sales records from Instacart, the popular online grocery store Instacart. The project produced sales trend analyses and marketing profiles to aid in targeted advertising campaigns.
Rockbuster Stealth
An analysis of sales records from Instacart, the popular online grocery store Instacart. The project produced sales trend analyses and marketing profiles to aid in targeted advertising campaigns.
Rockbuster Stealth
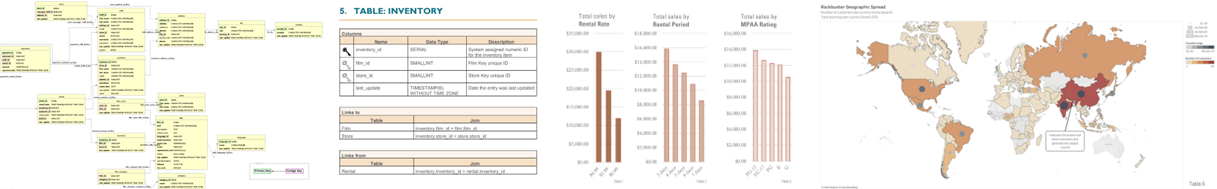 Preparing a video rental company for an online streaming upgrade. An audit of the company's inventory, transactions, and customer databases yielded a business risk assessment and insights into advisable actions.
Medical Staffing Agency
Preparing a video rental company for an online streaming upgrade. An audit of the company's inventory, transactions, and customer databases yielded a business risk assessment and insights into advisable actions.
Medical Staffing Agency
 Predicting medical staffing demands at the state level throughout flu season. The analysis uses US Census Bureau and CDC records to get staff-to-patient ratios within 10% of optimal hospital and clinic levels.
GameCo
Predicting medical staffing demands at the state level throughout flu season. The analysis uses US Census Bureau and CDC records to get staff-to-patient ratios within 10% of optimal hospital and clinic levels.
GameCo
 GameCo, a platform video game company, wanted a fresh understanding of the gaming market. An analysis of current video game trends and the performance of their rival companies gave them the competitive edge they needed.
Resume
Summary
Data analyst with 10 years’ experience in data, project management, and consulting. Drives complex, data-driven solutions to increase understanding, optimize efficiency, and advance opportunities. Looking for a long-term data-oriented role in a team-based environment.
Skills
Python              SQL                    Tableau
Excel               Word                   PowerPoint
Data cleaning       Data visualization     Data wrangling
Dashboards          Probability            Statistics
Communication       Critical thinking      Time management
Collaboration       Attention to detail    Presentations
Conflict management Creative problem solving
Experience
Independent Contractor and Consultant
Self-employed | Columbia, MO | April 2021 – Present
- Analyzed project histories to create standard predictive cost models, increasing project ROIs
- Used compassionate communication and adaptive teaching with clients, contractors, and suppliers, generating 25% higher profits per project than peer crews
- Advised on industry best practices and safety standards increasing efficiency, customer satisfaction, and profits as well as reducing accident and injury rates
Senior Project Manager
Ionia, Inc. | Kasilof, AK | January 2018 – April 2021
- Developed, produced, and hosted a virtual health/wellness course mid-pandemic, saving 19% of the company’s annual income from COVID-19 losses and gaining an additional 8%
- Led teams of up to 20 from multiple departments and time zones to produce and host hands-on mental health/wellness courses and seminars
- Managed and reported on private and federal grants, worth upwards of $200,000
Data Analyst
Ionia, Inc. | Kasilof, AK | June 2012 – December 2020
- Conducted monthly cleaning and reconciliation of transportation data with Excel, maintaining personal privacy and keeping in compliance with federal cost share programs
- Created year-end analyses, forecasts, and stakeholders’ reports with Excel and PowerPoint increasing understanding of and satisfaction with the organization’s accomplishments
- Composed quarterly reports of grants, updating board members on current projects
Project Manager
Ionia, Inc. | Kasilof, AK | March 2013 – January 2018
- Developed adaptive scheduling systems, equipment maintenance routines, and material logs improving understandability for seasonal staff and clients with mental health conditions
- Maintained active communication with volunteers and partner organizations, bolstering program participation, transportation coordination, and event performance
- Directed venture to create ergonomic, light-weight firewood carts enhancing elderly participation in activities and giving local youths work experience in product development
Academic
Career Foundry
Data Analysis Certification
2022
University of California, Los Angeles
Bachelor of Arts
Summa Cum Laude
2009
Moorpark College
Associate of Arts
2007
Contact
Please contact me via LinkedIn or email with any questions.
Check out my GitHub, Tableau, and Kaggle pages to peruse my handywork.
Behavioral Risk Factor Surveillance System
Summary
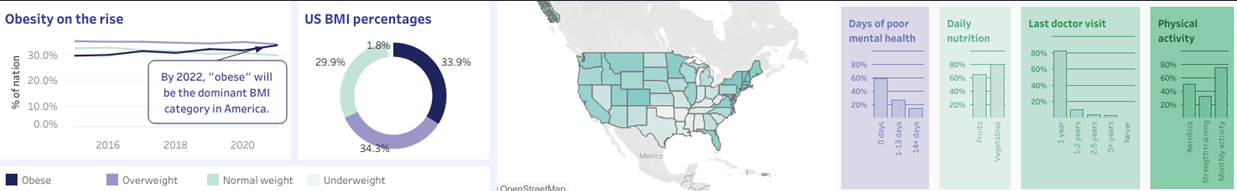
Healthcare providers, policy makers, and health-conscientious individuals need to know the basic health statistics of their states to make informed decisions. This Behavioral Risk Factor Surveillance System (BRFSS) is the premier source for these statistics. This project simplifies the BRFSS’s annual health survey data into easily understood dashboards and datasets.
Tools
Python, Jupyter notebooks, Tableau, MS Excel, MS PowerPoint, GitHub, Kaggle
Skills
Open sourcing, data manipulation, data sub-setting, data cleanine, data wrangling, data mapping, exploratory visual anlysis, correlation analysis, time-series analysis, geospatial analysis, linear regression, dashboard design
Objectives
- Transform the BRFSS data into a more accessible tabular dataframe.
- Create and upload subsets of the original data to facilitate public use.
- Provide current regionally relevant health metrics for healthcare professionals and policy makers.
- Create public dashboards explaining key BRFSS insights.
Process
Source a sufficiently robust set of public health records. Learn the variables' relationships to one another, their meaning, and significance. Keep a detailed project log of all steps taken in the analysis.
Data cleaning: remove irrelevant years, variables, topics, questions, and classes; validate data for type, range, consistency of expressions, and null values; standardize temporal variations.
Build a data dictionary to reduce dataset storage size and help ease of understanding.
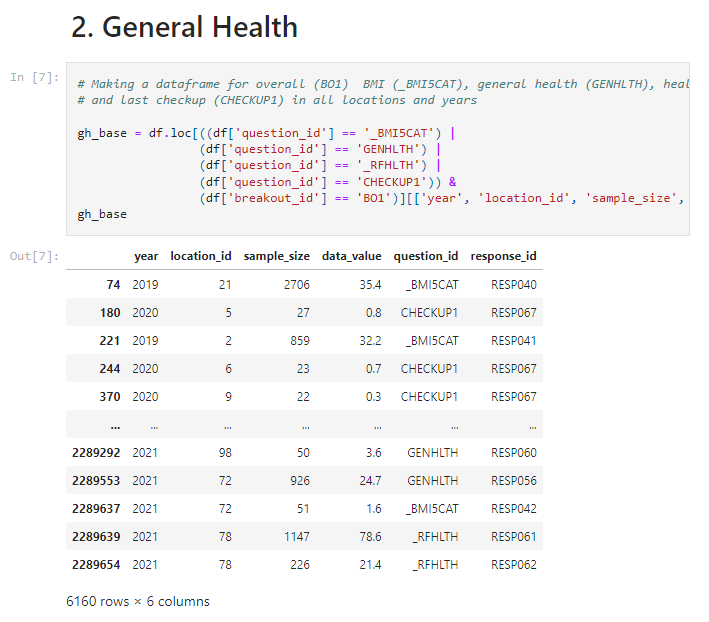 Wrangle the data into categorical health subsets via a standardized trnasformation process. The subset categories are: general health, dietary health, mental health, physical activity, and overall health.
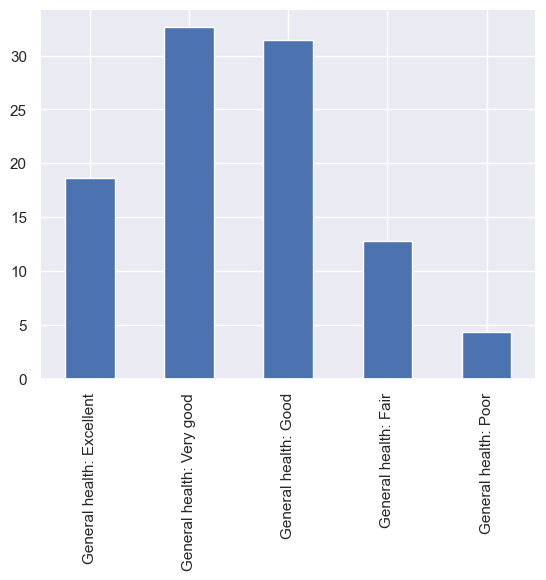 Establish national averages by calculating and plotting the summary statistics for each question response. This will provide a baseline to evaluate response averages on the international and the state levels.
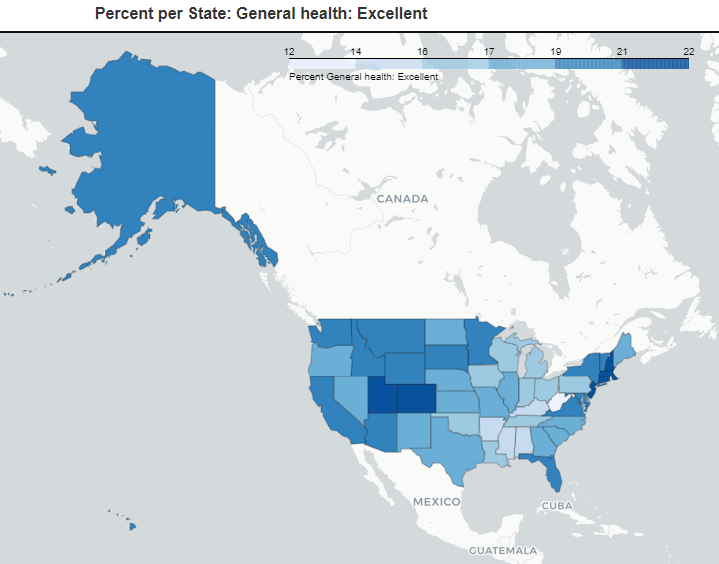 Examine geospatial trends on the state level in six key health categories. Writing custom plotting functions expedited the process of plotting choropleths for each response.
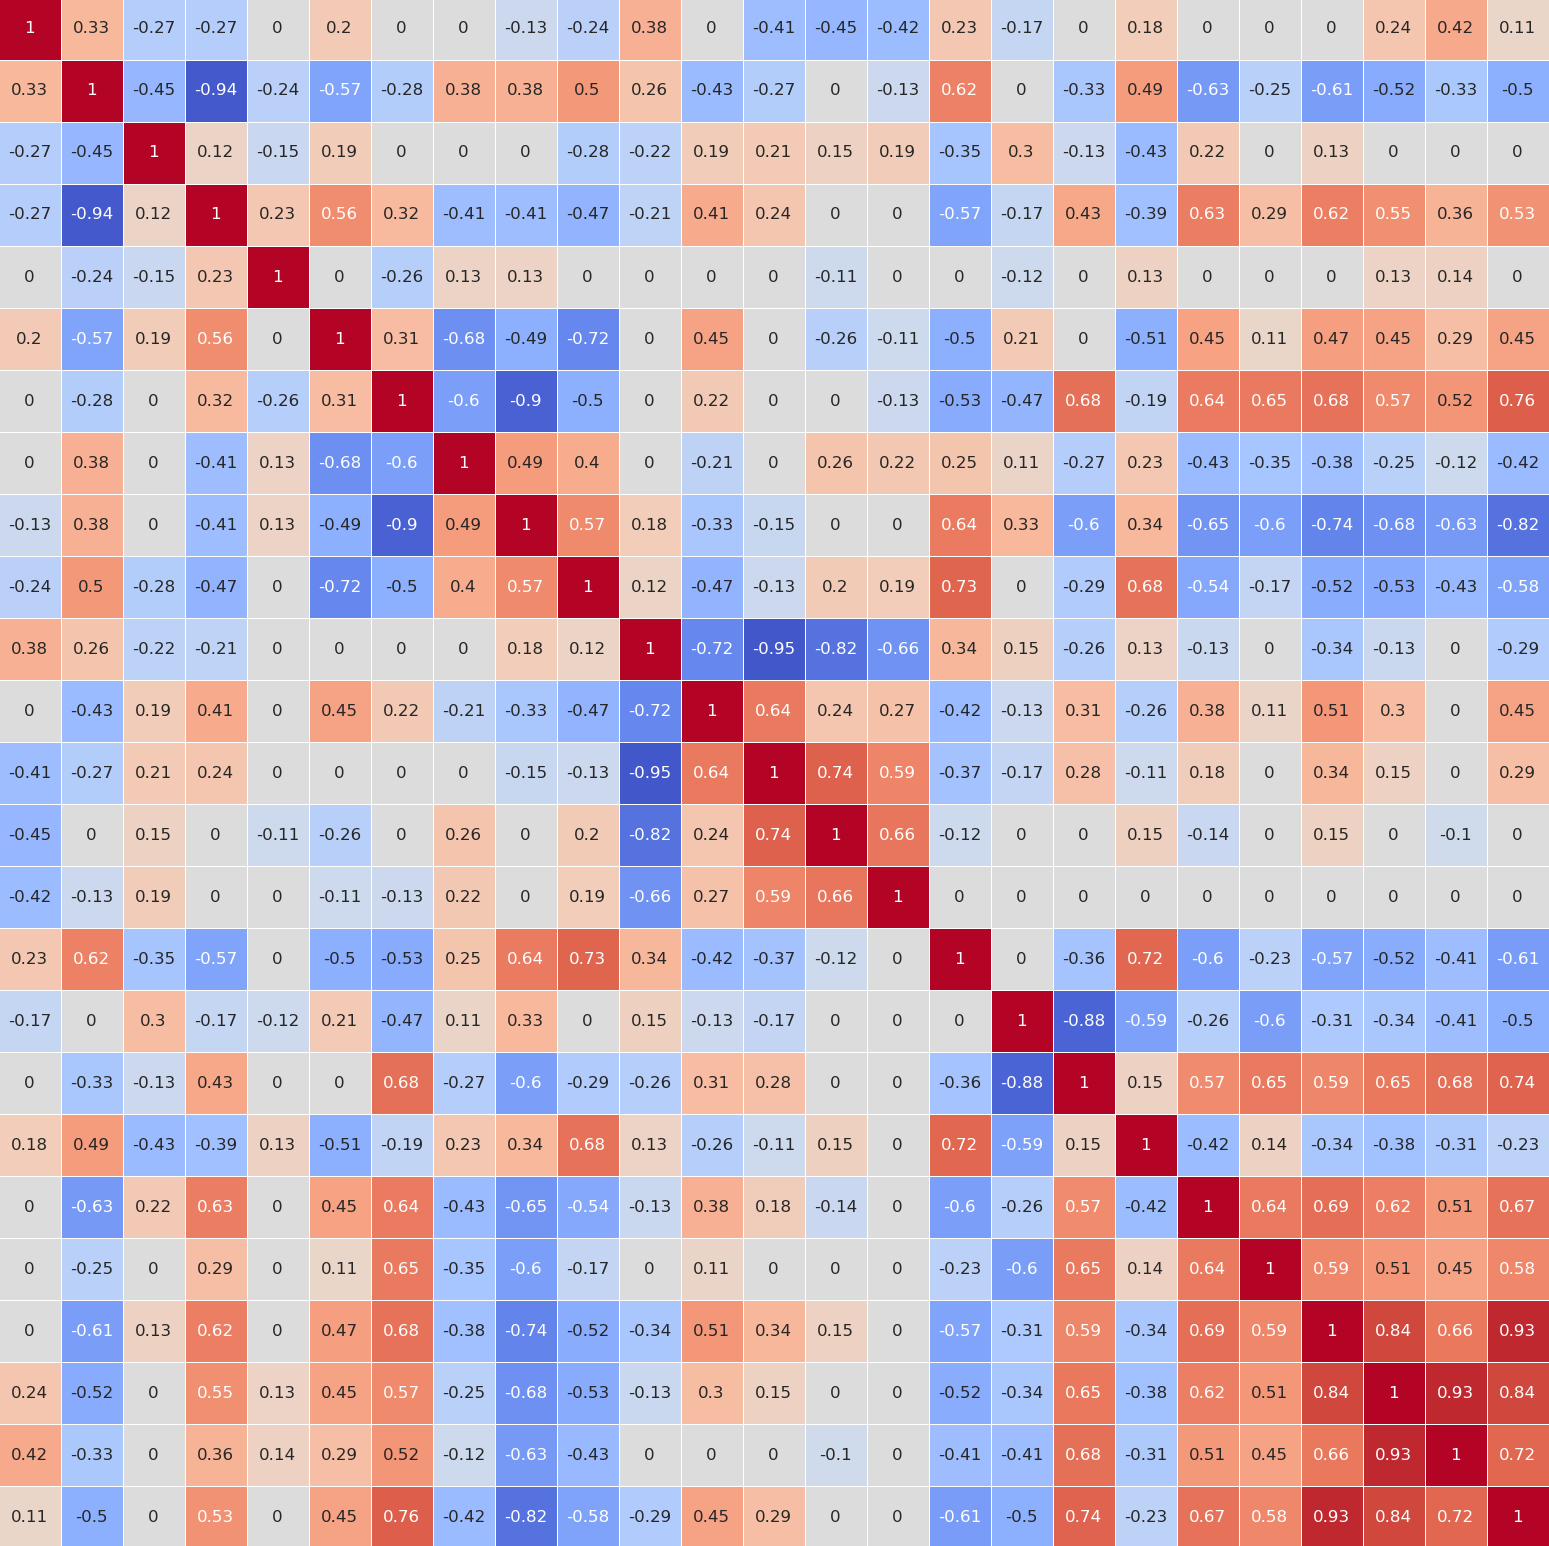 Plot correlation heatmaps in strong, medium, weak, and health category groups. The additional groupings help prioritize and direct subsequent steps of the analysis.
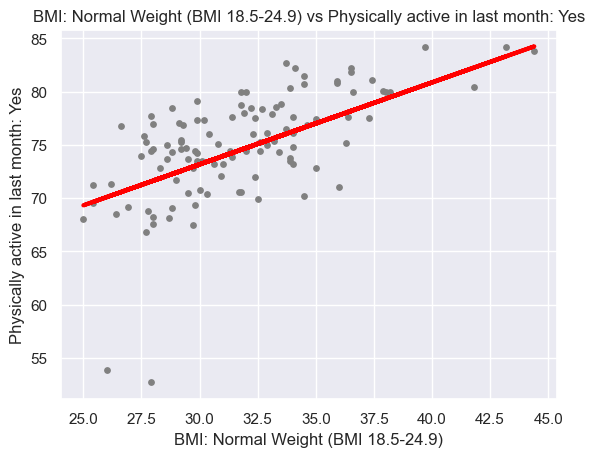 Linear regressions explored the predictability of variable pairs with strong correlative relationships. User defined functions expedited the process by revealing variable pairs with the strongest regression statistcs and rapidly plotting regessions for easy visual anlysis.
A time-series analysis highlighted which factors were improving over time and which were getting worse. This helped set a prioritize the dashboard building queue.
A formal ranking system let the results of the analysis be communicated and visualized more effectively. Multiple variables from each health category were weighted and combined to make the ranking system. States were ranked in six individual health categories and one combined overall category.
Linear regressions explored the predictability of variable pairs with strong correlative relationships. User defined functions expedited the process by revealing variable pairs with the strongest regression statistcs and rapidly plotting regessions for easy visual anlysis.
A time-series analysis highlighted which factors were improving over time and which were getting worse. This helped set a prioritize the dashboard building queue.
A formal ranking system let the results of the analysis be communicated and visualized more effectively. Multiple variables from each health category were weighted and combined to make the ranking system. States were ranked in six individual health categories and one combined overall category.
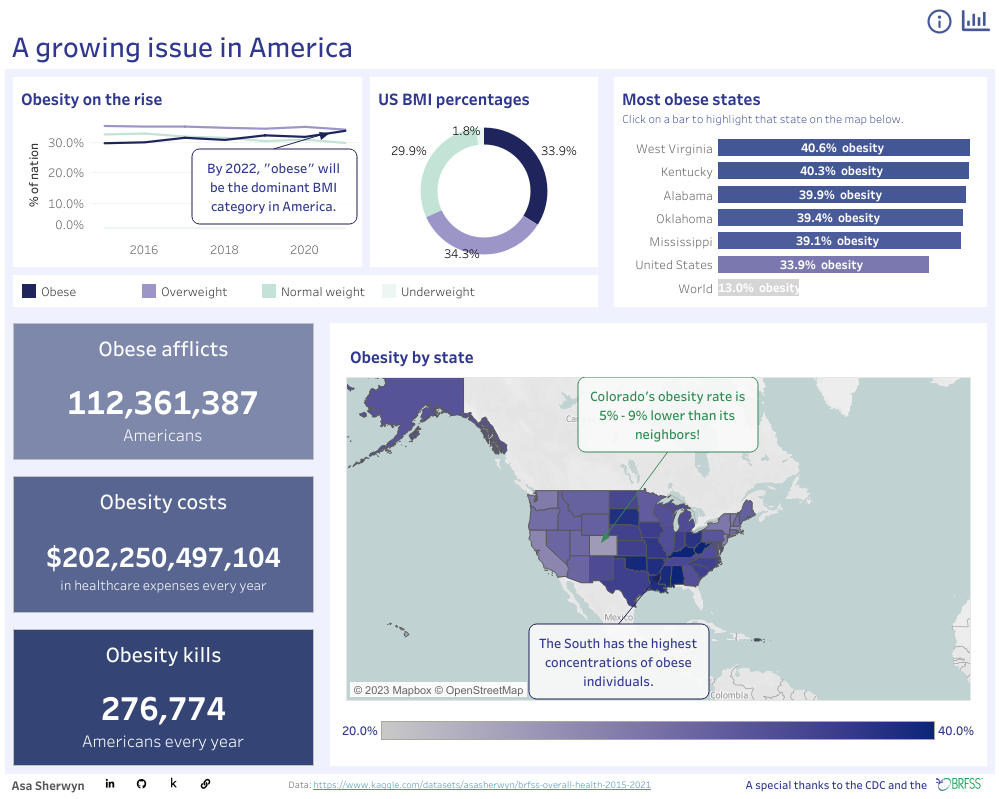
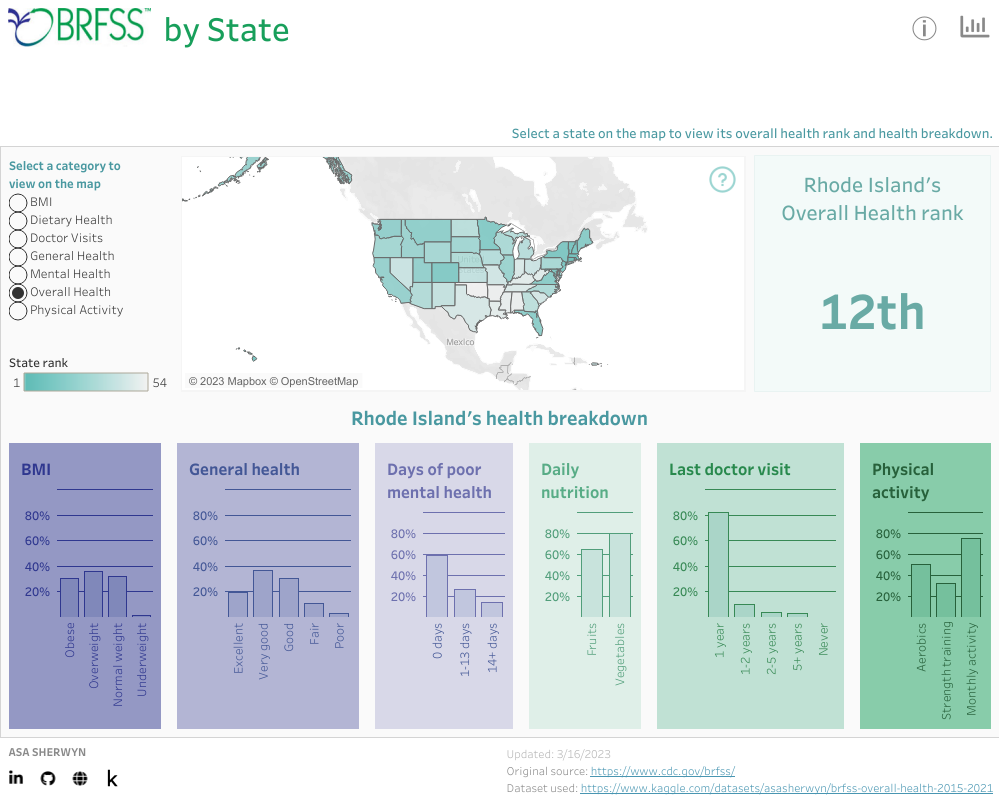 The results from the analyses were compiled into visually compelling, interactive Tableau dashboards.
Insights
- 66% of Americans are overweight or obese and obesity rates are on the rise.
- 39% of Americans experience some mental health struggles.
- 24% of Americans are physically active less than once a month.
- The South ranks poorly for BMI, general health, mental health, dietary health, and physical activity.
Deliverables
Dashboards
Obesity in America
BRFSS by State
Data Subsets
Overall Health
General Health
Mental Health
Dietary Health
Physical Activity
Project Links
Project Log
Case Study
GitHub Repository
Data
Specs
- 2.29 million records by 27 variables
- 54 states, provinces, and territories
- 2011 - 2021
- Downloaded: 12/14/2022
Sources
Connecticut Residential Real Estate '11-'21
Summary
In the state of Connecticut, people sell approximately 40,000 residences totaling $14.8 billion, every year. Numerous factors contribute to the final selling prices of these residences. Being able to accurately predict a property's selling price can be a huge boon to sellers, buyers, realtors, and investors.
This analysis examines the impact of six individual variables on the closing sale amount of residential properties in Connecticut from 2011 to 2021.
This study then uses these findings to assess the effect of the COVID-19 pandemic on town and state level real estate trends.
Tools
Python, Jupyter notebooks, Tableau, MS Excel, MS PowerPoint, GitHub
Skills
Data storytelling, data manipulation, data cleaning, data wrangling, data merging, geospatial analysis, linear regression, k-means clustering, time-series analysis, dashboarding design, Consumer Price Index normalization
Objectives
Find out:
- What are the effects of a property’s assessed value, town, local population, selling month, selling year, and street number on its final selling price?
- When is the best time to sell a residence?
- Where do homes sell for the highest prices?
- Is the Connecticut real estate market going up or down?
- How has COVID-19 effected the market?
Process
Source reliable real estate records and begin a project log to keep a detailed account of all steps taken during the analysis.
Clean and wrangle the data for relevance and to normalize monetary values via the US Bureau of Labor and Statistics' Consumer Price Index.
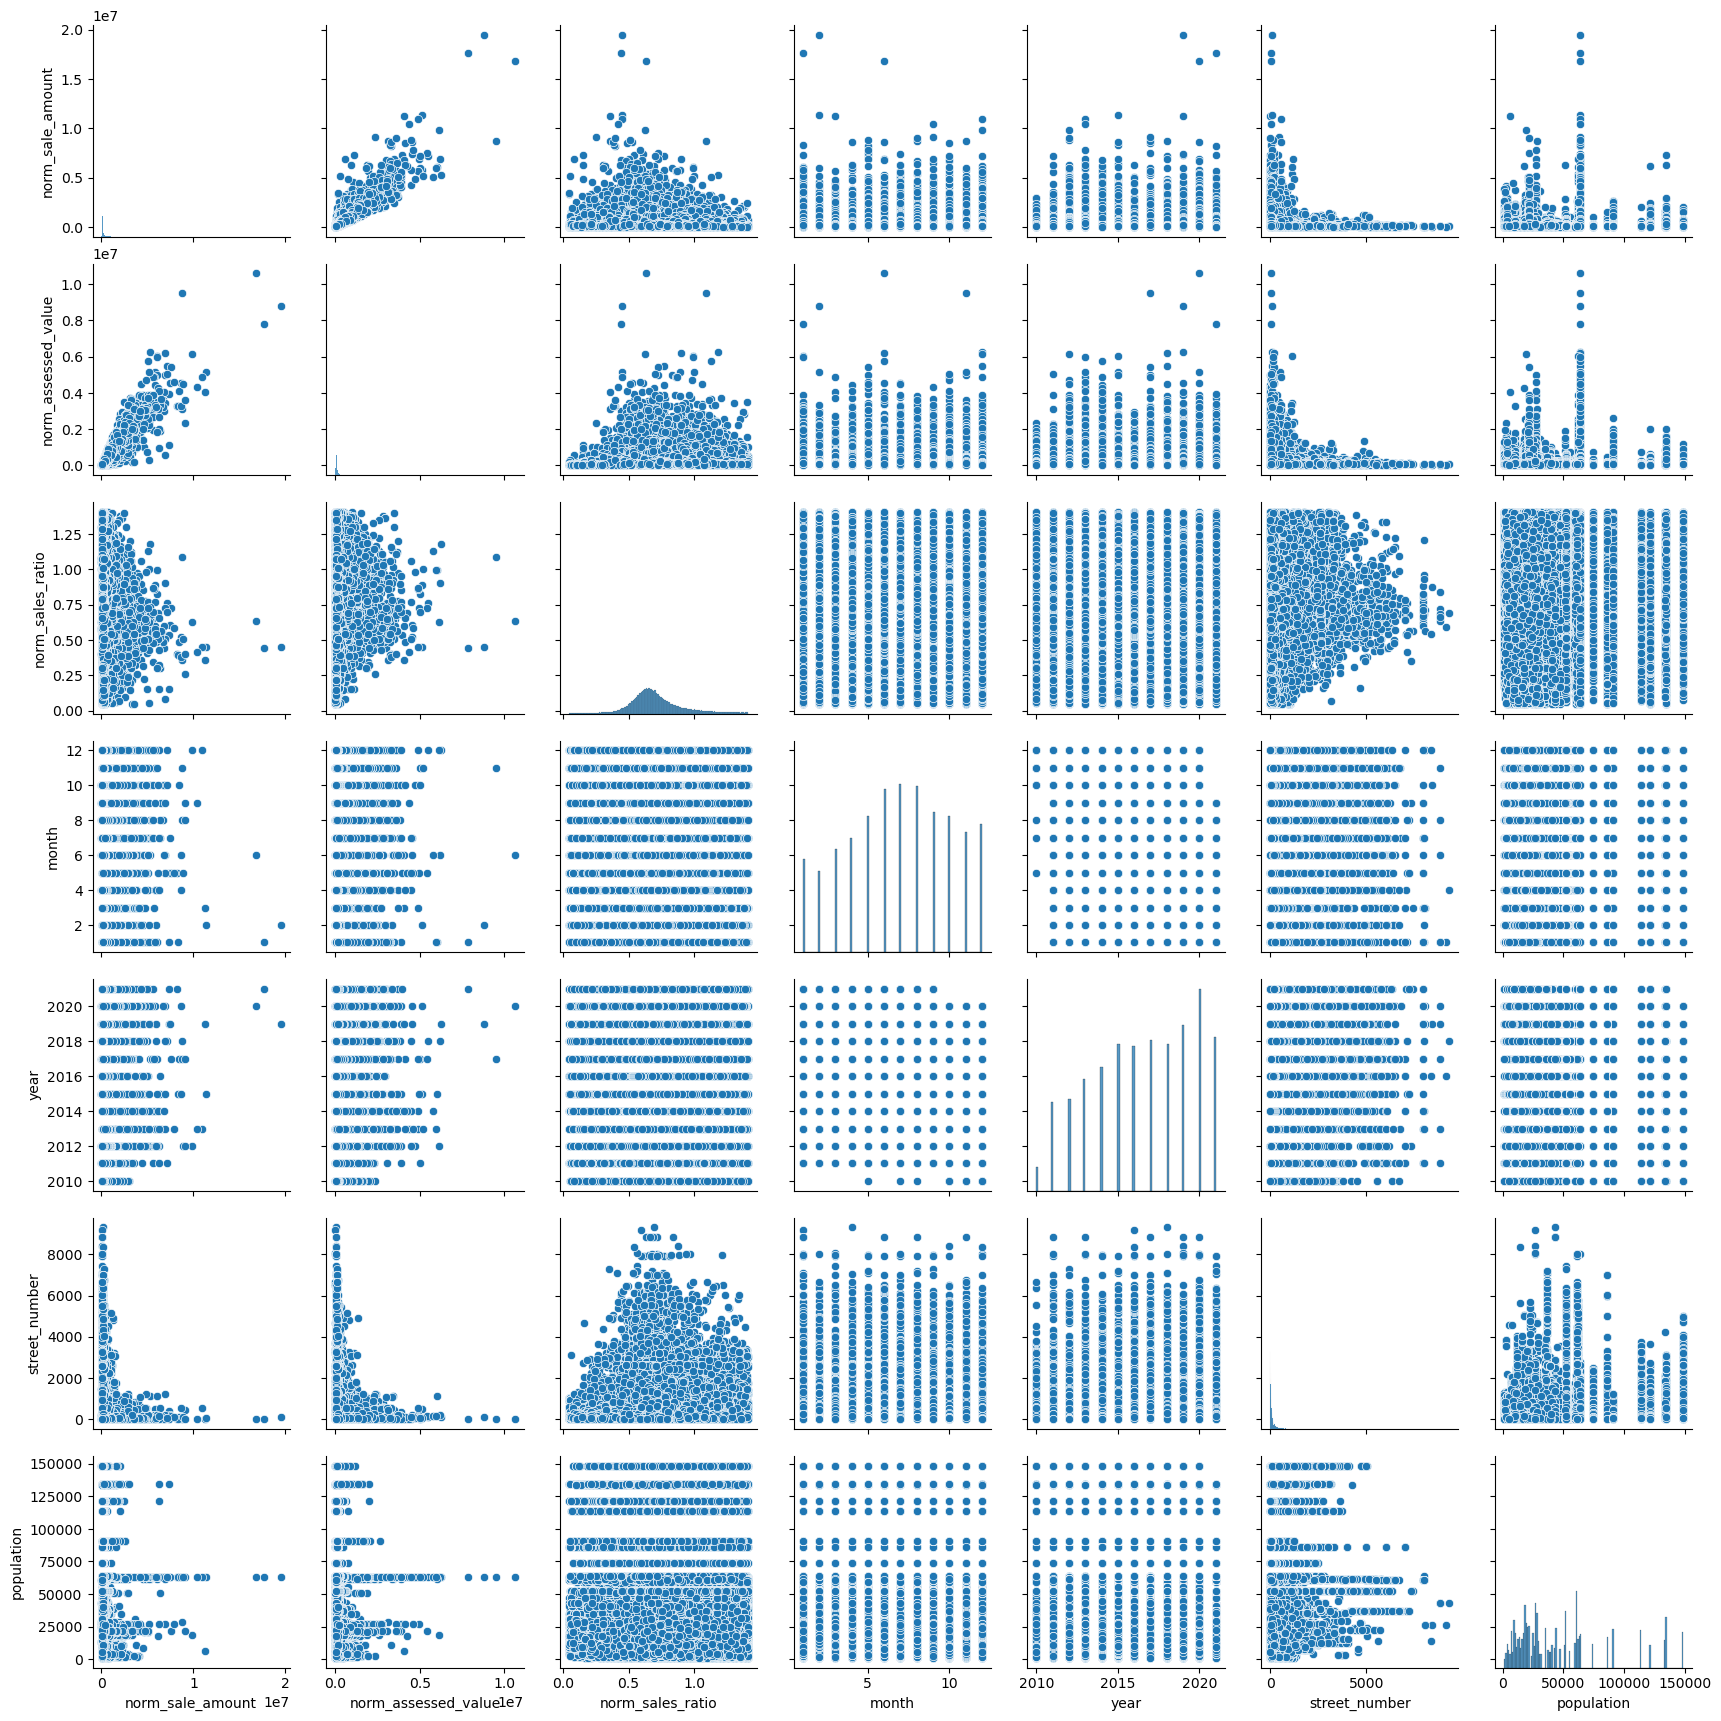 An exploratory visual analysis gave a basic understanding of the data and led to the hypothesis that as assessed value increases, so does the final selling price.
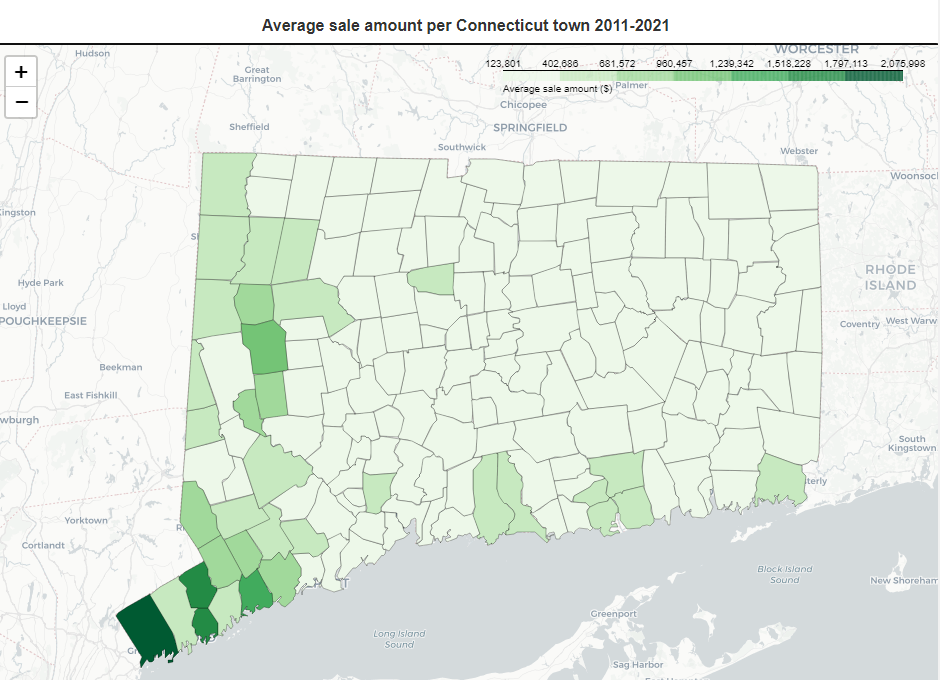 A geospatial analysis indicated that towns in the south-west corner of the state (nearest New York City) tend to have the largest sales, populations, and volume of sales.
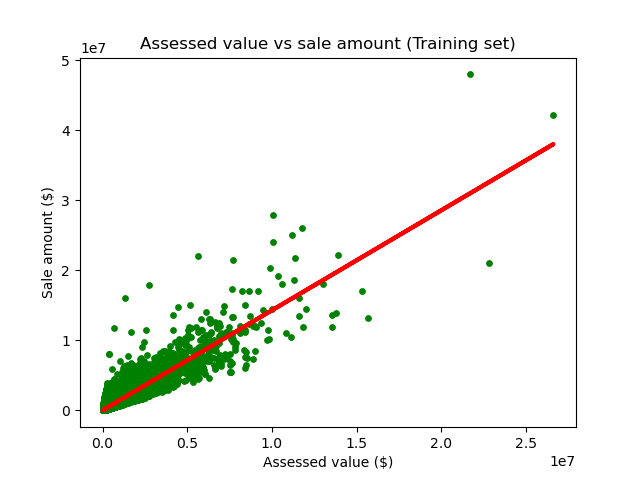 Linear regressions confirmed that a property's assessed value is a strong predictor of its final selling price.
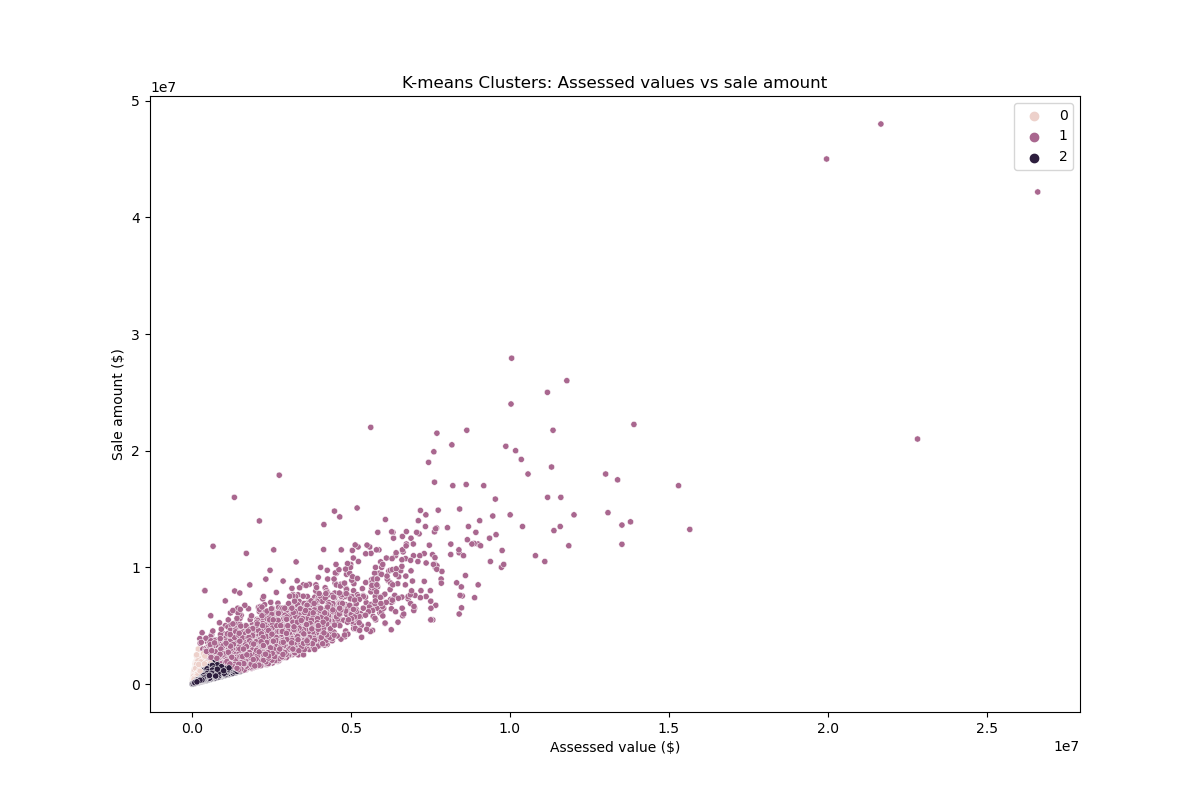 A k-means clustering algorithm revealed distinct trends for high and average valued properties.
The data was categorized into pre- or peri-pandemic groups to the effect of COVID-19 on the Connecticut real estate market.
A k-means clustering algorithm revealed distinct trends for high and average valued properties.
The data was categorized into pre- or peri-pandemic groups to the effect of COVID-19 on the Connecticut real estate market.
Insights
Deliverables
Tableau Storyboard
Case Study
GitHub Repository
Project Log
Data
Specs
- 430,492 records by 20 variables
- 169 towns
- 4 open-sourced datasets
- October 2010 to September 2021
Sources
Instacart Basket Analysis
This page is under construction. Please check back later.
Rock Buster Stealth LLC
This page is under construction. Please check back later.
Medical Staffing Agency
Summary
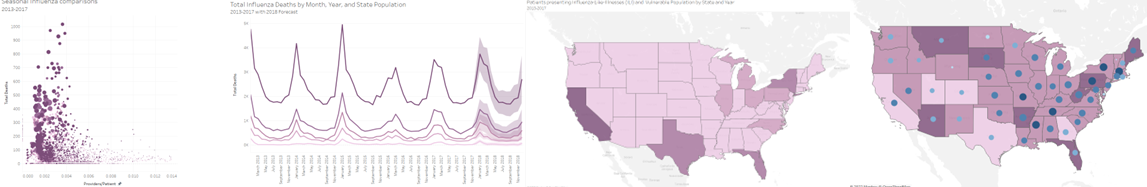
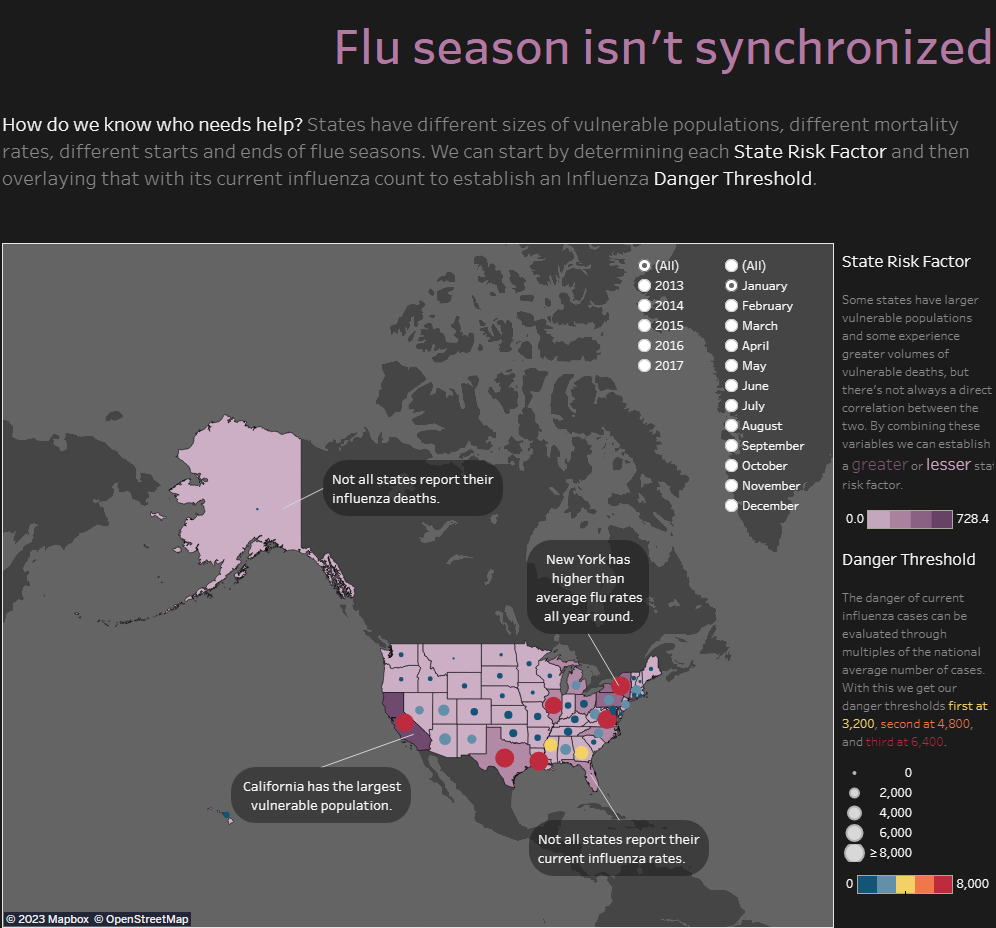
A medical staffing agency, that provides temporary workers to clinics and hospitals on an as-needed basis, sought help navigating the flu season. They requested staffing guidelines that would keep under and over staffing within 10% of optimal staff-to-patient ratios in each of the 50 US states. A synthesis of CDC and US Census Bureau records led to an interactive forecasting dashboard.
Tools
MS Excel, Tableau
Skills
Business requirements document, requirements gathering, data cleaning, data integration, data transformation, statistical hyptothesis testing, exploratory visual analysis, forecasting, dhashboard design, storyboard design, video presentation
Objectives
- Provide information to support a staffing plan, detailing what data can help inform the timing and spatial distribution of medical personnel throughout the United States.
- Determine whether influenza occurs seasonally or throughout the entire year. If seasonal, does it start and end at the same time (month) in every state?
- Prioritize states with large vulnerable populations.
- Assess data limitations.
Process
Translate the agency's BRD into questions and deliverables.
Clean, combine, and assess the relevant datasets.
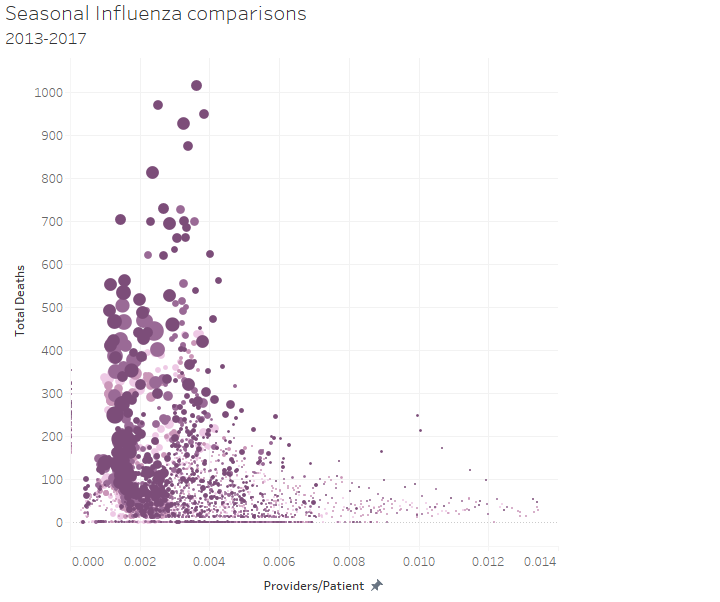 Create a scatter plot check the theory that ideal staffing ratios help reduce influenza mortality rates. Then validate the theory with a statistical hypothesis test.
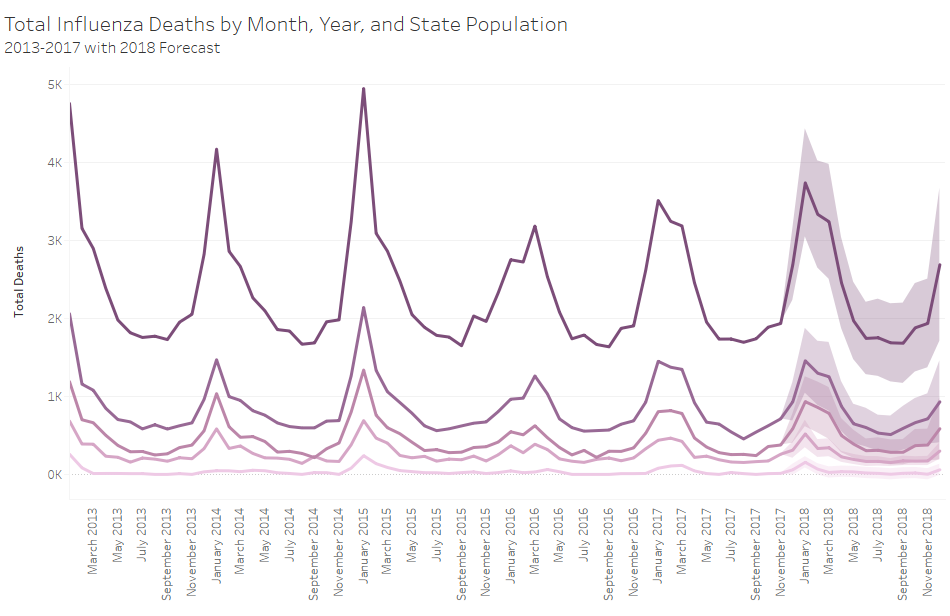 Conduct a time series analysis to check for seasonality in influenza contraction and mortality rates.
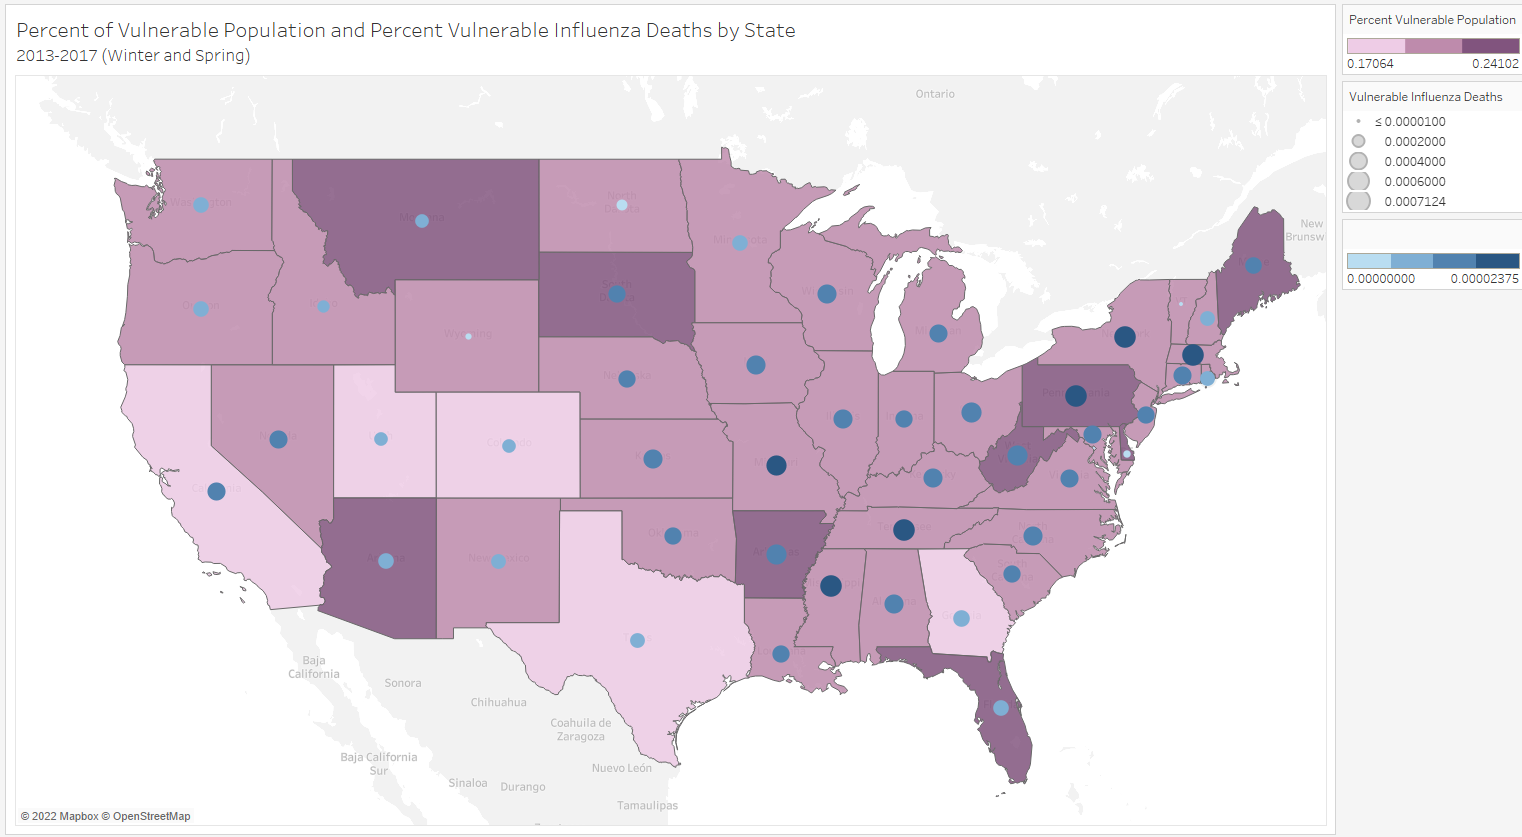 Examine geospatial trends in influenza contraction and mortality rates via choropleths.
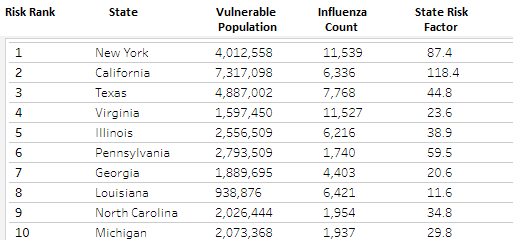 Compile all findings into a prioritize list of states that can be adjusted for time of year.
 Build a compelling storyboard with interactive dashboards to fulfill the medical staffing agency's requirements.
Insights
- A state's staffing priority depends on its current influenza count and its average vulnerable population size.
- Flu season peaks in January is elevated from November through April.
- California, Texas, Florida, and New york have the largest average vulnerable populations.
- Alaska, Delaware, and Florida have not provided enough data to be accuaretly assessed.
Deliverables
Case study Tableau Storyboard
Data
GameCo
Summary
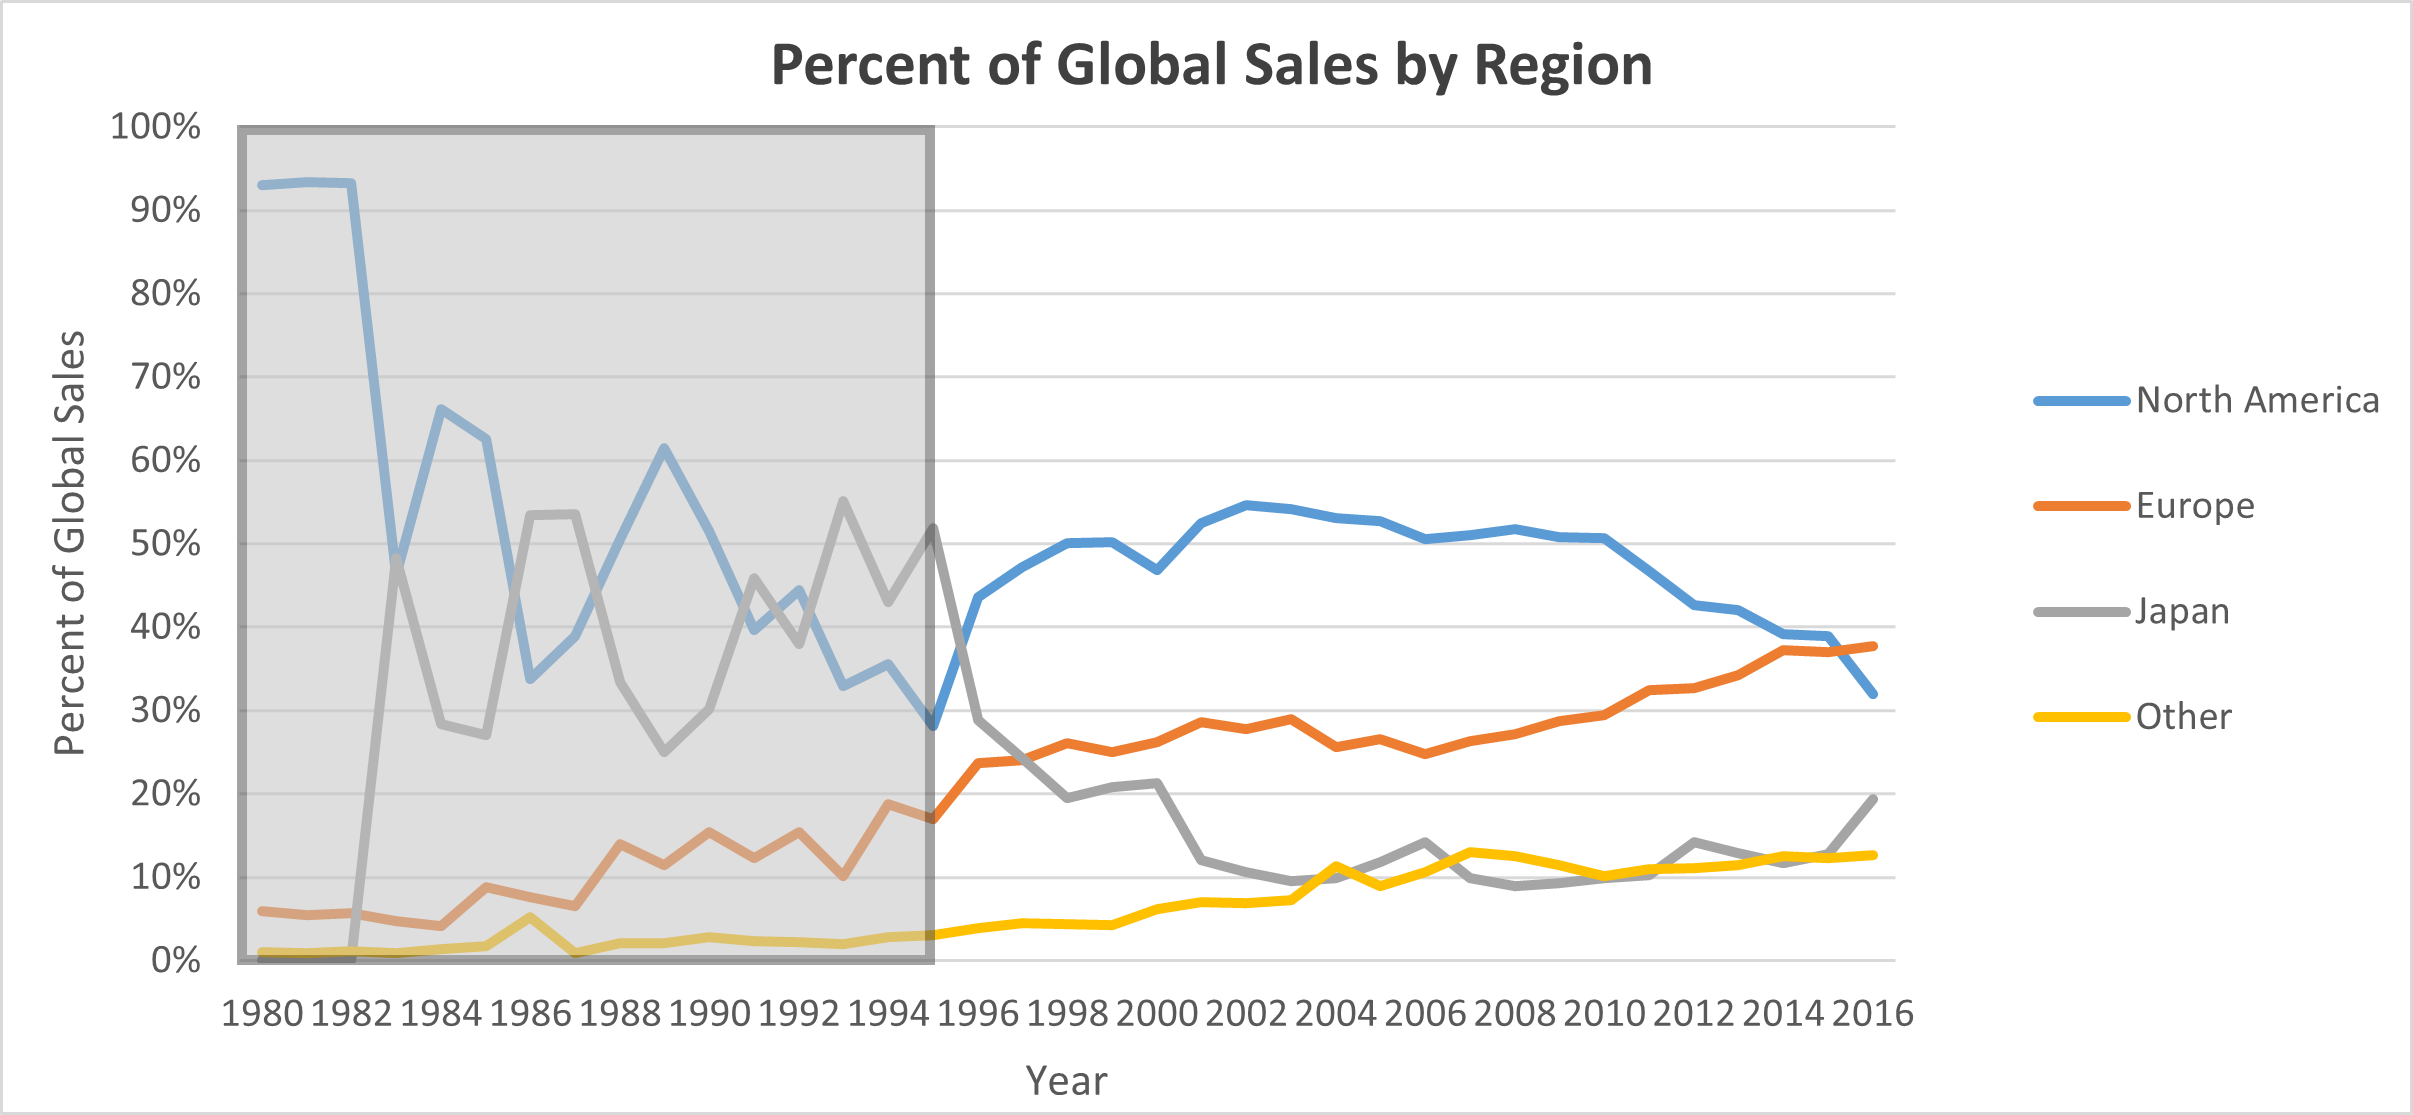
GameCo, a new video game company, needed updated insights into the gaming industry to direct the development of their products. They requested a descriptive analysis of historic video game sales across major regional markets. The project resulted in a report that provided summary details of the market, findings that challeneged their current understanding of the industry, and actionable insights to help them succeed.
Tools
MS Excel, MS Powerpoint
Skills
Data profiling, data cleaning, data visualization, data reporting, pivot tables, statistical analysis, descriptive analysis, trend forecasting.
Objectives
Find out:
- If some types of games are more popular than others.
- Have any games changed in popularity over time.
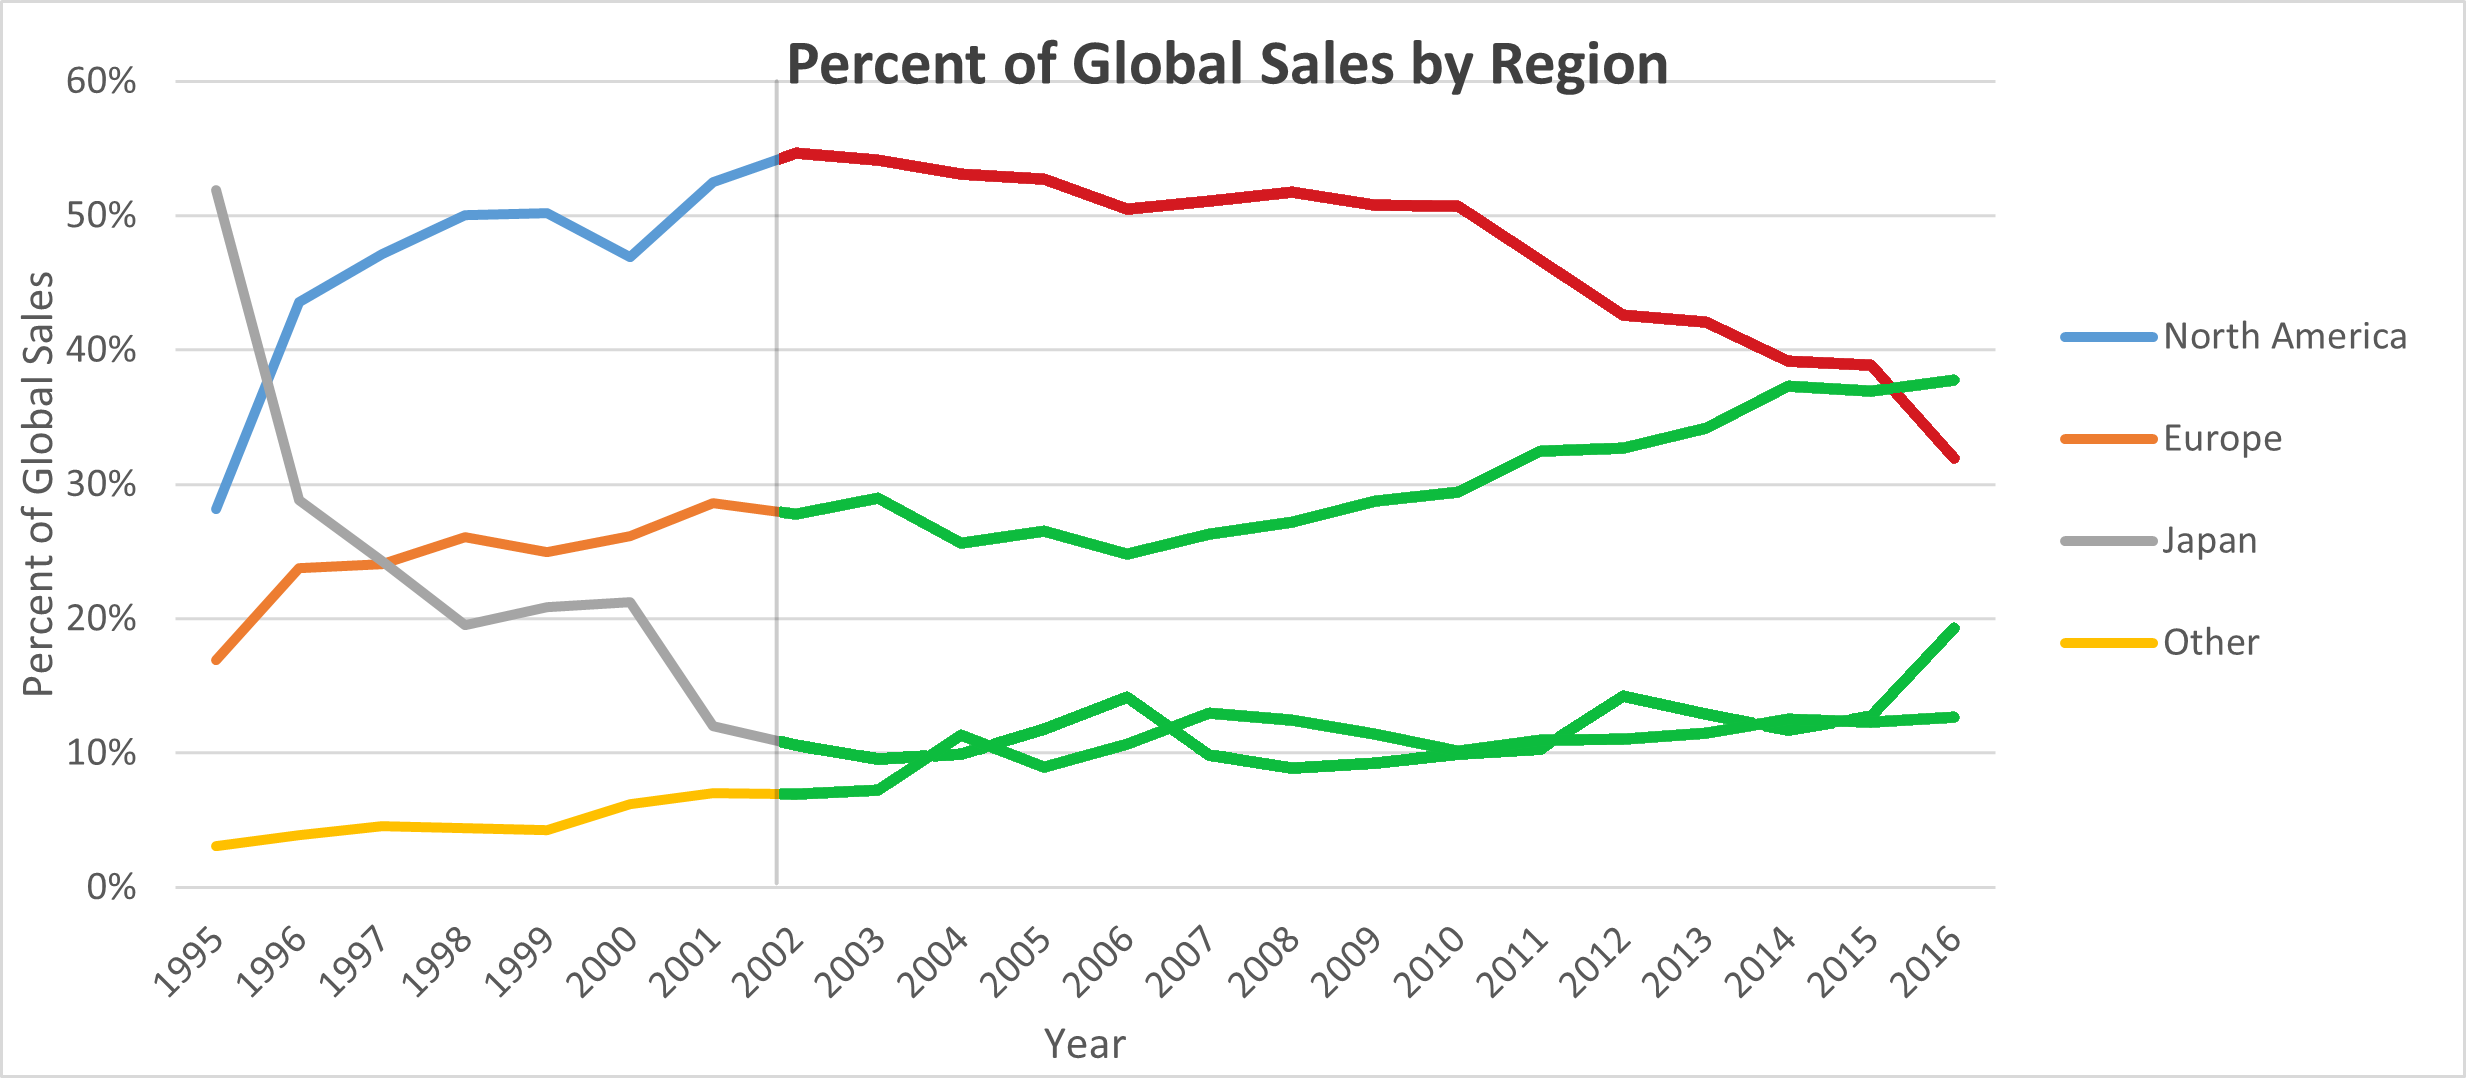
- How have sales varied by region over time.
Process
Refining questions and answers were exhcanged with the stakeholders to pinpoint the desired deliverables.
The data was cleaned, removing or imputing values for incomplete records, unifying categorical values, and reducing the number of years for relevance.
 Pivot tables aggregated information to give a clear understanding of the data and help create visualzations.
 The key findings and visualizations were compiled into a compelling stakeholders' report.
Insights
- Popularity of genres varies strongly by region. Overall, action, shooter, and sports games are currently the most popular.
- Puzzle, racing, simulation, and strategy games have been decreasing in popularity.
- Action, shooter, and sports games have been increasing in popularity.
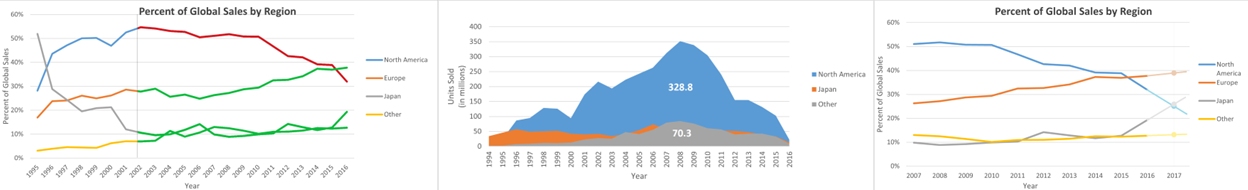
- Most sales during the 2000s have been in North America, but North American sales have been in decline since 2002.
- In 2015 Europe surpassed North America as the market leader.
- All markets have saw a massive decline in sales from 2008 to 2016.
Deliverables
Case study Report
Data
- Records of videogame sales over 100,000 units
- From 1980 to 2016
- Final dataset: 16,590 records and 10 variables
- Original data from VGChartz.com
Xyz

Summary
xyz
Tools
x, y, z
Skills
x, y, z
Objectives
Find out:
Process
x
x
 x
x
x
Insights
Deliverables
Data
Elements
Text
This is bold and this is strong. This is italic and this is emphasized.
This is superscript text and this is subscript text.
This is underlined and this is code: for (;;) { ... }. Finally, this is a link.
Heading Level 2
Heading Level 3
Heading Level 4
Heading Level 5
Heading Level 6
Blockquote
Fringilla nisl. Donec accumsan interdum nisi, quis tincidunt felis sagittis eget tempus euismod. Vestibulum ante ipsum primis in faucibus vestibulum. Blandit adipiscing eu felis iaculis volutpat ac adipiscing accumsan faucibus. Vestibulum ante ipsum primis in faucibus lorem ipsum dolor sit amet nullam adipiscing eu felis.
Preformatted
i = 0;

while (!deck.isInOrder()) {
    print 'Iteration ' + i;
    deck.shuffle();
    i++;
}

print 'It took ' + i + ' iterations to sort the deck.';
Lists
Unordered
- Dolor pulvinar etiam.
- Sagittis adipiscing.
- Felis enim feugiat.
Alternate
- Dolor pulvinar etiam.
- Sagittis adipiscing.
- Felis enim feugiat.
Ordered
- Dolor pulvinar etiam.
- Etiam vel felis viverra.
- Felis enim feugiat.
- Dolor pulvinar etiam.
- Etiam vel felis lorem.
- Felis enim et feugiat.
Icons
Actions
Table
Default
| Name |
Description |
Price |
| Item One |
Ante turpis integer aliquet porttitor. |
29.99 |
| Item Two |
Vis ac commodo adipiscing arcu aliquet. |
19.99 |
| Item Three |
Morbi faucibus arcu accumsan lorem. |
29.99 |
| Item Four |
Vitae integer tempus condimentum. |
19.99 |
| Item Five |
Ante turpis integer aliquet porttitor. |
29.99 |
|
100.00 |
Alternate
| Name |
Description |
Price |
| Item One |
Ante turpis integer aliquet porttitor. |
29.99 |
| Item Two |
Vis ac commodo adipiscing arcu aliquet. |
19.99 |
| Item Three |
Morbi faucibus arcu accumsan lorem. |
29.99 |
| Item Four |
Vitae integer tempus condimentum. |
19.99 |
| Item Five |
Ante turpis integer aliquet porttitor. |
29.99 |
|
100.00 |

